Bitcoin Looks for Support Near $58K Amid Macro Headwinds
Triple-bottom setup and RSI divergence offer hope for the bulls
Bitcoin (BTC) fell below the $60,000 threshold on Wednesday, reaching a low in the $58K region, and creating a near-perfect triple bottom on the Daily chart. The drop was not caused by a single catalyst but a combination of factors that are working together to drag the crypto market lower.
The Fed recently made a hawkish shift in stance, although many thought the new Fed Chair, Kevin Warsh, would cut the interest rate quickly to appease President Trump. The President mentioned on multiple occasions that the rate is too high and the Fed should do something about it. He repeatedly called the former Fed Chair “Too Late Powell”, and the general opinion was that the new Chair shares Trump’s views on the rate.
However, that was before the Middle East conflict erupted, which changed the geopolitical scene and introduced inflationary pressures coming from the oil crisis. There’s a distinct possibility that the Fed will actually hike the rate instead of cutting it this year, and this is weighing on risk assets such as cryptocurrencies.
Another reason for Bitcoin’s weakness is investor sentiment. The AI trade is much more appealing to investors, so capital is shifting from crypto into AI stocks. Bitcoin doesn’t even react to good news like the potential end of the US – Iran war, but on the other hand, stocks like Micron Technology (MU) and Sandisk (SNDK) are printing new historical highs almost every day.
Spot Bitcoin ETFs are adding to the bearish sentiment as outflows dominate the scene, and a green day is hard to find. On Wednesday, the overall outflows added to $469 million, and a day prior to $113 million, according to data from Coinglass. The last day that registered overall inflows was June 16, with a meagre $10 million.
Chart Analysis – BTC/USD
This year’s price action created a triple bottom, which is a bullish pattern that usually appears at the end of a downtrend. It’s worth noting that the last move went slightly lower than the previous two bottoms; however, the pattern can still be considered a relatively good triple bottom. Also worth noting is that after the second bottom, the price failed to rally above the first resistance ($65K), which is a sign of weakness.
Although we saw a minor recovery after the drop below $60K, the price could still drop below $58K, invalidating the triple bottom setup. Such a breakdown could trigger a cascading move towards $55K, with long liquidations creating extra bearish pressure.
Bullish divergence is currently present on the Daily chart: the RSI made a higher low, while the price printed a slightly lower low. This is not the strongest form of divergence, but it could support the idea of a stronger relief rally.
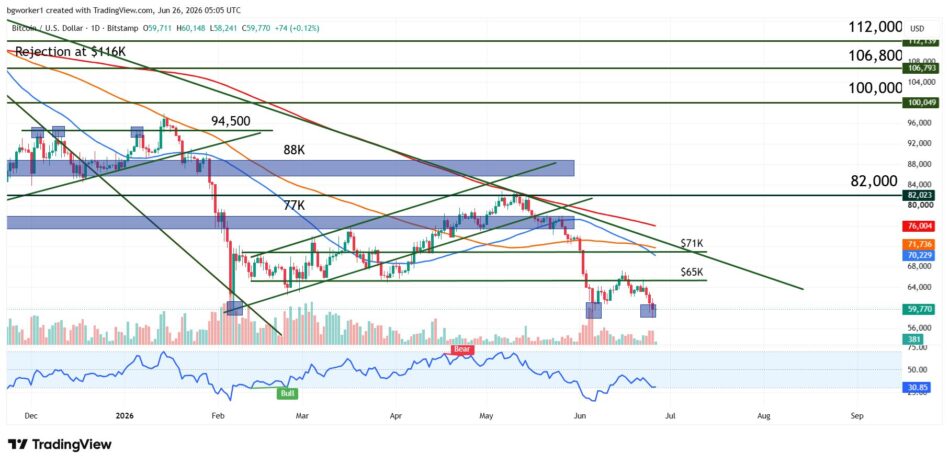
Bitcoin tests a potential triple bottom near $59K, with bullish RSI divergence supporting a recovery attempt while $65K remains the first major resistance.