Ceasefire Risks and Inflation Data Drive Market Outlook
EUR/USD approaches major support with breakdown risk increasing
The dollar strengthened throughout last week, mostly thanks to the hawkish tilt shown by the Fed and the anticipation of at least a rate cut by year’s end. The US Dollar Index (DXY) jumped to a 13-month high after new quarterly projections showed that 9 of the 19 Fed policymakers see a rate hike in 2026. Against the euro, the dollar reached 1.1400, a price last seen in March 2026 and before that, in July 2025.
The agreement reached by the US and Iran is already being tested, as Israeli forces clashed with Iran-backed Hezbollah on Saturday. According to Reuters, at least 20 people were killed in Lebanon by the Israeli strikes. Israel said the strikes were in retaliation for projectiles launched overnight by Hezbollah. Israel accused the US of failing to enforce the recent Memorandum of Understanding, which included a ceasefire on all fronts.
Economic Calendar Highlights
The US Manufacturing and Services PMIs will be released on Tuesday at 1:45 pm GMT, showing the opinions of purchasing managers on the current level of business conditions. The PMI is not typically a major market mover, but its impact can be significant if the actual reading differs substantially from expectations.
The most important release of the week will be the US Core PCE Price Index, scheduled for Thursday at 12:30 pm GMT. This is the Fed’s preferred inflation gauge, which can strongly affect the interest rate outlook. The economic week will end on Friday at 2:00 pm GMT with the release of the Revised UoM Consumer Sentiment survey, which is another low-to-medium impact indicator.
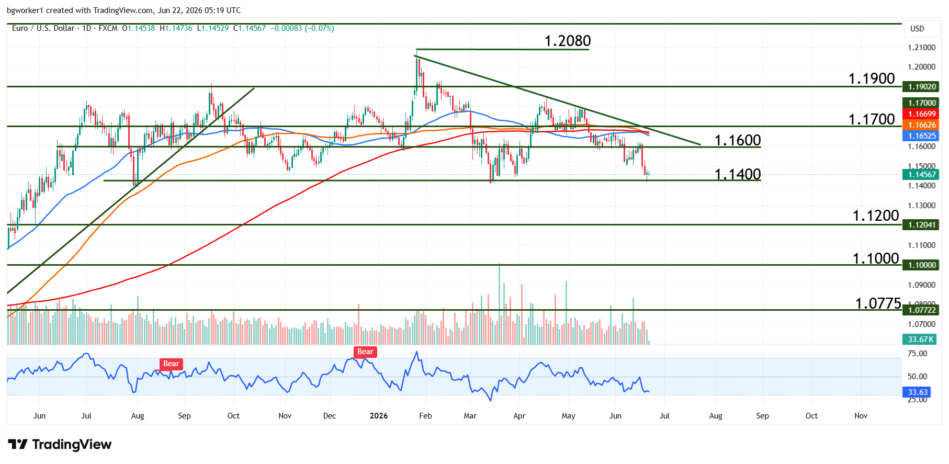
Technical Outlook – EUR/USD
The pair tested 1.1600 and turned it into resistance before dropping to 1.1400 and ending the week very close to this key support level. The level was tested three times since July 2025 and represents the lower boundary of the trading range (1.1900 – 1.1400).
The bears seem to be in control of the price action, but the support at 1.1400 proved to be very difficult to break in the past. It wouldn’t be surprising to see a rejection at the current level, which would mean the range-bound trading will continue, possibly with choppy price action.
A break of 1.1400 would be a trigger for a move towards 1.1200, while a bounce would probably send the pair closer to the 50-day Moving Average (blue line on the chart) and the bearish trend line drawn from the 1.2000 high.
EUR/USD tests the lower boundary of its long-term range as traders assess the durability of the Middle East ceasefire and await key US inflation data.