2/2 ITM(+105$ Net Profit): Analyze multiple TF
Good Day everyone,
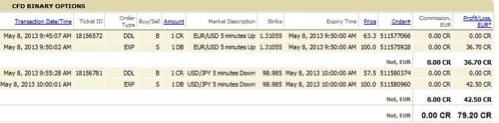
In this article I will share with you my today trades and setups and I will explain you why is important to analyze multiple timeframes before take your trades. For today, I had a 2/2 ITM performance with a 105$ Net Profit. Here are my trades.
Let’s go to the first screen shot of the day. It’s from EURUSD currency pair.
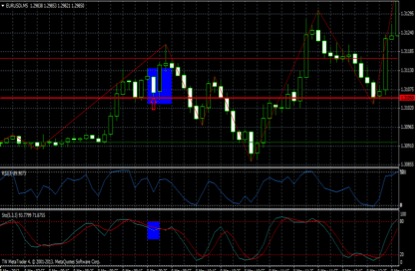
As you can see from the chart we are in a ranging market. I took a call in the arrow in the blue box. The red line in this spot is a recent support. Notice that the candle hit the support and there is a small rejection here to the support line. The stochastic lines are very close and maybe will be a possible crossover. I use a 5min chart. My trade was finally a solid ITM but look, our data are not so clear at this moment. There isn’t an oversold condition in our 3 period RSI and the price hasn’t test again our support and we don’t know if it’s strong this moment to keep the price and makes a pull back or not. So, in a condition like this in which we don’t have a clear picture of the market we should leave and don’t take a trade or we should analyze a smaller timeframe like the 1min chart to identify if there is a trade opportunity or not. Let’s see the 1min chart of EURUSD at the same time.
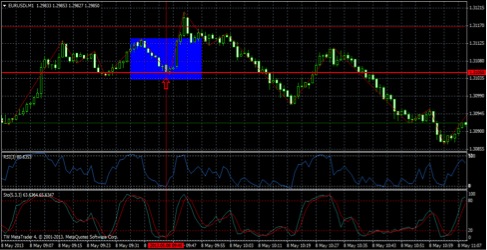
Do you think that we have a clear picture of the market now? Of course we have. First of all, the price hit the support like the 5 min chart. Moreover, our 3 period RSI is extremely oversold. Last but not least, in the Stochastic Oscillator there is already a crossover near the oversold area (level 20) and the blue line is above the red. Another buy signal.
So, we have a clear picture of the market now, we have evidence, we have confluence in two time frames and finally there is a trade opportunity. I took the call trade and it was a solid, risk free, ITM.
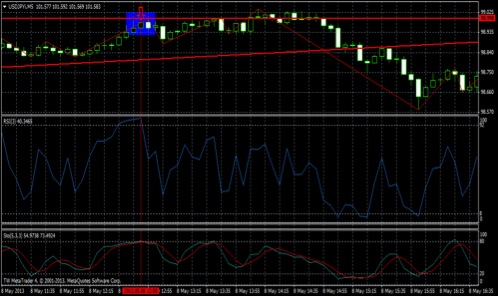
Here is my second trade of the day. It’s USDJPY currency pair. The price is moving in a channel. The red line up is our resistance and the red line down is our support. Look at the RSI. As the price is moving to the resistance the RSI is already over bought and is moving side ways, as I have mentioned in my previous article. The stochastic oscillator is close to a sell crossover and there is question. When should we get in? In a case like this we should see if the market is trending or ranging. If it’s trending try to avoid the trade. In our case the market is ranging and the best time to make our entry is when the price hit the resistance. It was a solid ITM Put.
Kind Regards,
Kostasze