Where Does Bitcoin Go From Here? Up, Up, Up
Bitcoin Reaches All-time High and Multi-Year Low – All Within 2 Days
by Bogdan Giulvezan
The last couple of days have been a roller-coaster ride for the flagship cryptocurrency: on October 20, it reached a new all-time high at $66,909 according to CoinMarketCap data and on some exchanges, it climbed as high as $67,016 (Bitstamp). But… one day later, Bitcoin flash-crashed to $8,200, and that’s not a typo!
At the time of writing, Bitcoin is trading very close to $63,000, as most of the losses were erased in about 1 minute. The flash crash was best observed on the price feed of Binance.US and was apparently triggered by a bug in an institutional trader’s algorithm. It is unclear if automated trading is to blame or if we are dealing with a classic “fat finger” error where the trader manually entered the wrong price. However, according to a Binance.US spokesperson, it is the former: “One of our institutional traders indicated to us that they had a bug in their trading algorithm, which appears to have caused the sell-off that was reported this morning”. The spokesperson also added that “We are continuing to look into the event but understand from the trader that they have now fixed their bug and that the issue appears to have been resolved”.
Other major exchanges experienced only negligible price fluctuations: for example, on Bitstamp, BTC only dropped around 2.3%, without moving lower than $63,600 at the time; Coinbase was largely unaffected and on other exchanges, Bitcoin dropped to around $64,000 from $65,500.
It’s interesting to see that Binance, which is a giant in the industry, lacks some form of protection against large orders, algorithm misfires, and other such mishaps. On the other hand, Coinbase implemented a system that uses price protection points, which seems to do the trick because BTC traded smoothly on Coinbase at the time of the crash.
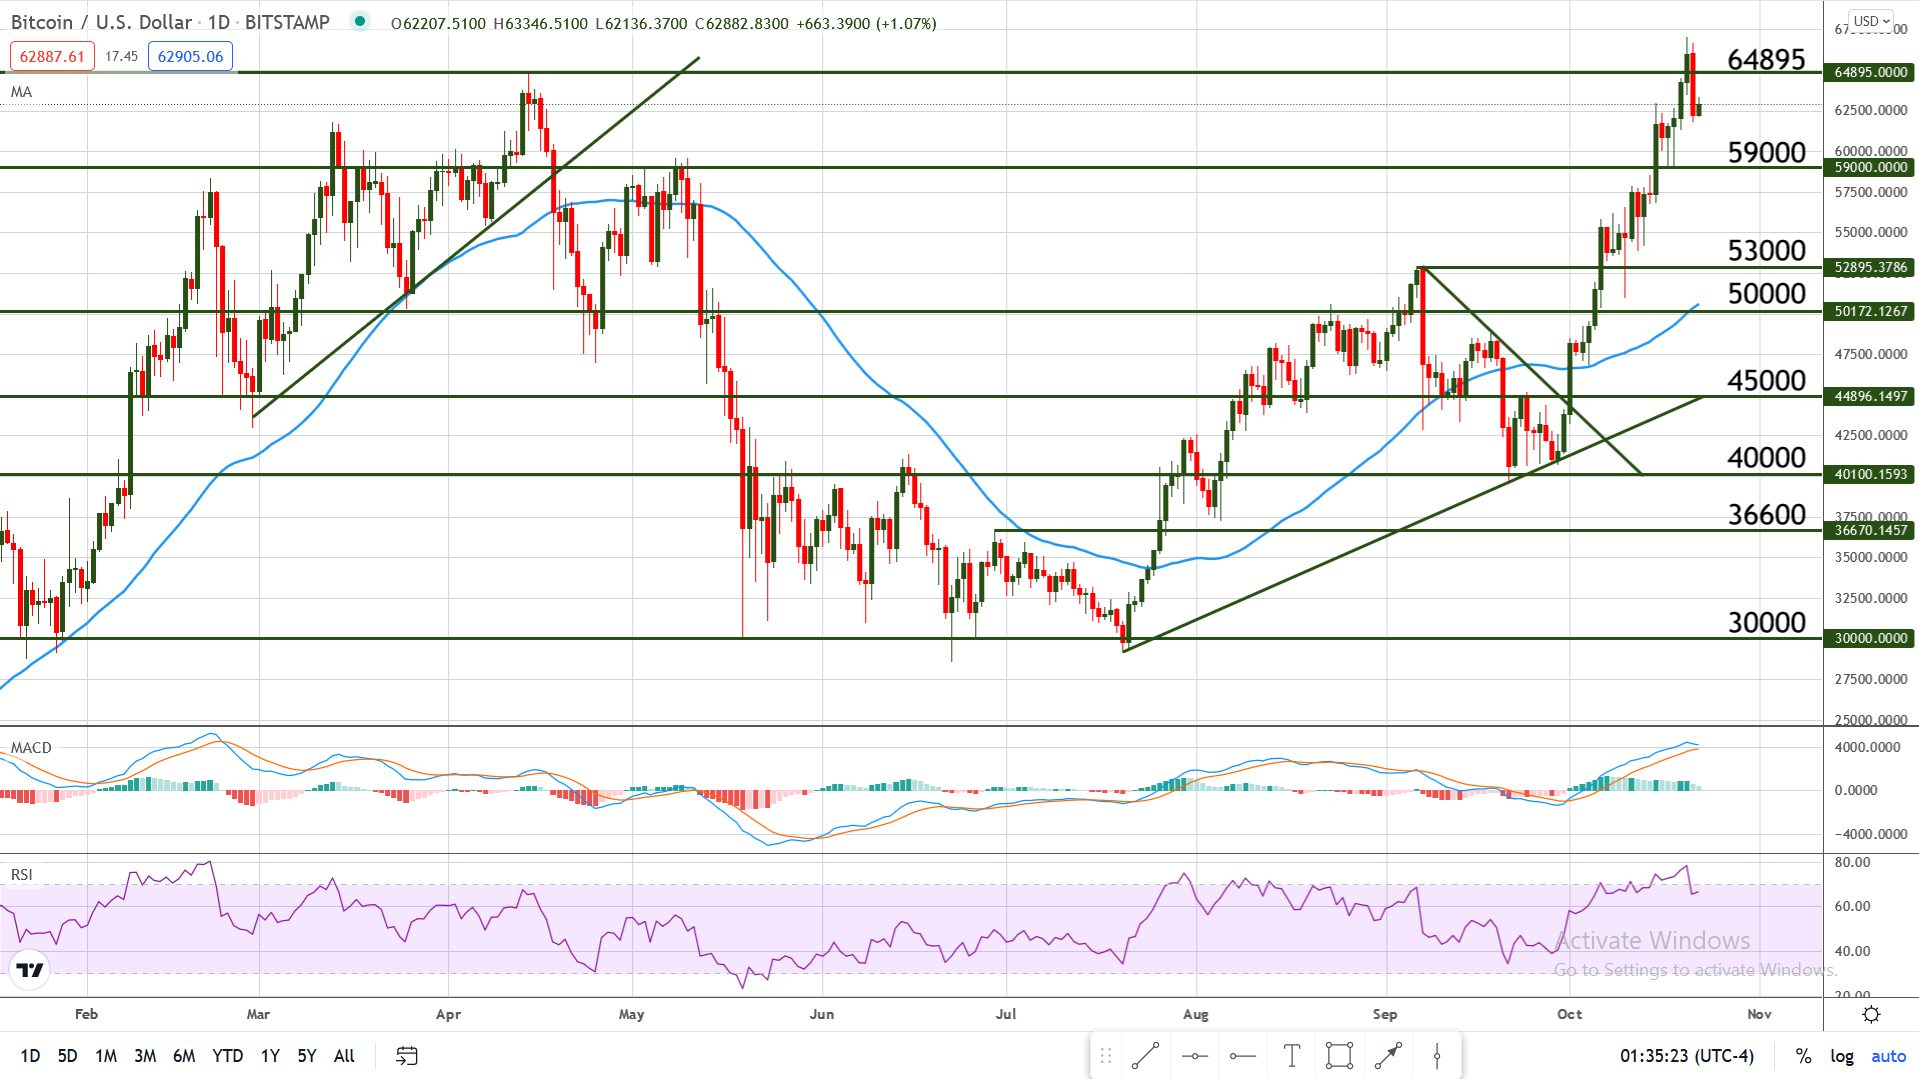
Chart Analysis – BTC/USD
After a brief climb above the previous high, now Bitcoin looks prone to a retracement, mostly because price is overextended. The Relative Strength Index is overbought since 14 October and the MACD lines are moving closer together, indicating that a pullback is in the works.
Last week’s price action showed that $59,000 is now support – as we can see from the chart below, two Daily candles touched the mentioned level, and then price immediately moved back up. This created two long-wicked candles, which is a sign of rejection.
With this in mind, a potential pullback may find support at $59K but on the other hand, a move above $64,895 (the previous high) will add more bullish pressure and will probably delay the pullback.