When Is A Bearish Signal Not Bearish?
Interpreting signals and indicators is the heart, soul and life of a technical analyst and day trader. The signals are how we make our bread and butter. The thing is, the signals are cold and heartless. They do not wave a flag saying “hey, trade me! I’m the best!”. You have to be able to read the lay of the market, read in between the lines and see beyond the curtains to what’s going on behind the scenes. Take candlesticks for instance, a black or a white candle can form at any time, on any day for almost any reason. If the trend is up and a black candle forms does that mean that trend has changed? No it doesn’t, not any more than if your chosen oscillator has rolled over against the prevailing trend. The fact that any indicator can produce a bullish or bearish signal at any given time if perhaps the most difficult thing for a new trader to understand. I know it was for me. I can’t tell you how many times I lost money reversing my position on a false or misinterpreted signal only to find out later I was right all along.
Time Frame
In order to help newbies, intermediate and even expert traders I have compiled a list of things to consider before reversing a position. These considerations are as valid in the bullish sense as they are in the bearish but for the purposes of this discussion I will stick to bearish signals in an uptrend and when they may not be bearish using candle sticks, support/resistance and the 30 bar EMA. The first thing to take into consideration is time frame. Time frame is a term you will hear time and time again and will have an impact on nearly everything you do as a trader, even if you don’t realize it. It only makes sense to think that a longer term trend is stronger than a shorter term trend. Therefore a bearish signal occurring on a chart of weekly prices will be stronger than a bearish signal occurring on a chart of daily prices. If we assume that each signal is equal in duration, that is both signals will take an estimated 2.75 bars to peak (I chose that number arbitrarily), we can assume that the long term signal will be nearly three weeks in length whereas the shorter term daily signal will only be about a half week or so. The long term signal may be bearish because of its length and potential depth; it could lead to major correction and/or reversal. The shorter term signal less so because it may only be indicative of a market pause, consolidation or near term market jitters.
Support and Resistance
Support and resistance are two other very important factors to keep in mind when analyzing a bearish signal. A bearish signal that occurs at or below a resistance line is much more likely to be an actual bearish signal than one that occurs at or above a support line. First lets talk about resistance, resistance is an area where we can expect a rally to pause, stop or reverse. In an uptrend there are many types of resistance the market can face. There is near term, short term and long term. There is technical and fundamental resistance as well psychological resistances such as round numbers and new highs. Each of these can produce a bearish signal but not all are bearish, most of them will in fact lead to a trend following entry especially if the asset is trending strongly. A long term resistance may be the top of a 12 month range, a previous high from years past or a significant level from a previous down trend. These levels will produce stronger bearish signals than a round number resistance or a near term peak caused by jitters. One key to understanding the strength of a bearish signal at resistance is time frame. The time frame of the resistance is often an indicator of how bearish the signal is. Less bearish signals are indicative of pause and consolidation while longer term signals are more indicative of correction and potential reversal.
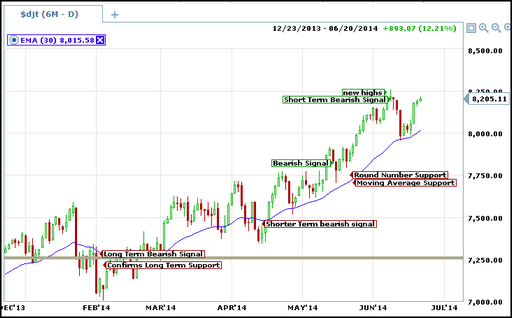
Now, bearish signals that occur at support during an uptrend are often signs of bullishness and not bearishness at all. These signals are illusions of bearishness that should be viewed as confirmations of support and potentially higher prices. In an uptrend there are several kinds of support including technical support in the form of consolidation bands, previous peaks, moving averages and many others including long, short and near term supports just like I described with resistance. Support, and test of support, come down to trend. If the trend is up, no matter what a bearish signal is more likely to precede a buying point than to be an actual bearish signal. When prices correct support is often where that correction ends. If you look at the chart above you can see how numerous bearish candle formations, tests of support, breaks of the moving average and round number resistances all produced bearish candles and potentially bearish signals but they all turned out to be buying times.