Ways to trade with the trend: Part I
Hey everybody,
If you read my previous articles you will notice that in the most of them I usually focus on reversals. In this article I am going to talk about the ways and techniques which I use to trade with the trend. I am sure that you have heard many times the expression “Trend is your friend”. It sounds so nice and easy but believe me it’s not so simply. If you want to trade with the trend firstly you must know some important things like : When does a trend begin? When does a trend end? When do we have a reversal? Which is the general picture? In this article I will answer these questions one by one.
Let’s see our first screenshot.
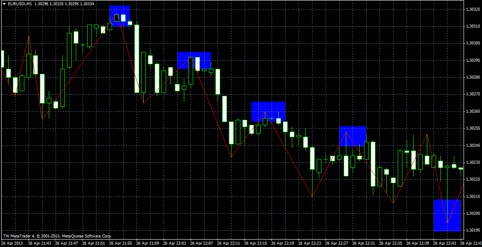
The most important thing for me in a trend is this picture. You can see that we have a down trend here. In the first blue box we have our high. Look at the price behavior. After the first blue box the price is moving down, makes a support and it’s trying to come back but it can’t. It makes a high lower than the previous. This is a lower- high. After that, in the next blue boxes we have again lower highs, the price is trying to come back but every time it makes a high lower than the previous. On the other hand , in an uptrend we have the opposite, higher- lows. This is a clear trending market for me. So, the next question is when we should jump in the trend.
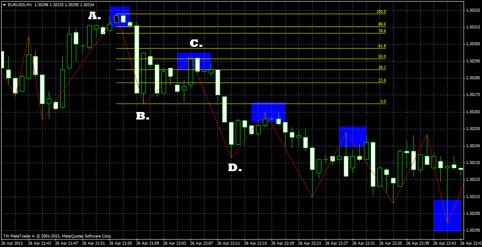
Here you can see the same screenshot but I drew the Fibonacci retracements of the leg A-B. In previous articles I said how to draw and trade an ABCD pattern. Many times as you know I use it in ranging markets and I trade reversals in letter D. In a trending market like this I don’t recommend to trade a reversal in letter D. The key letter for me now is C. The price makes a support in B and some minutes later make a 50 fib retracement in letter C. The key fib levels for me are 50, 61.8 and 78. 6 . In letter C you have the chance after the retracement to take a put and make a solid trade in the direction of the general trend. You can do the same thing in the next blue boxes.
With these two easy ways you can have the general picture of the market. You should also check with the same way the market in a bigger chart like the 5min chart. It must has the same picture if we are in a clear trend. All these are good but they are not enough. This condition is creating new questions like: Should we jump in 50 fib?Should we wait for a bigger fib retracement like 61.8 or 78.6?There is the risk to take an early trade and loose your money. To identify the right entry we will need some confirmation. Stay tuned!
Kind Regards,
Kostasze