Using Edson Gould Speed Lines to Provide Support and Resistance Areas
Speed Lines, developed by Edson Gould, are a predictive type indicator for trend traders. Once a trend has begun, the indicator points out places of likely support (for an uptrend) and resistance (for a downtrend). The support or resistance areas can be used as entry points, although typically some other form of analysis or indicator should used to confirm signals.
Speed Lines
The speed line indicator is composed of three lines. To use the tool, connect a low point to a high point during an uptrend. Unlike a trendline, this line will run through the price trend. Once this line is drawn two other lines will appear–these provide potential support areas for the uptrend.
Connect a high point to a low point during a downtrend and the two additional lines will provide likely resistance areas for the downtrend.
Figure 1. Speed Line on S&P 500 SPDR ETF (SPY)
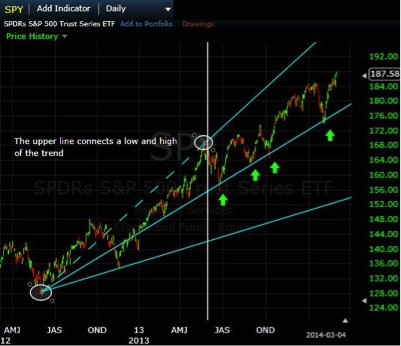
The two small circles mark the price points used to draw the indicator–the dashed line. The solid lines are likely to provide some predictive capability. In the time after the indicator was drawn (after vertical line) the price does respect the middle Speed Line.
If the price drops below the middle Speed Line the bottom Speed Line is likely to act as support as well.
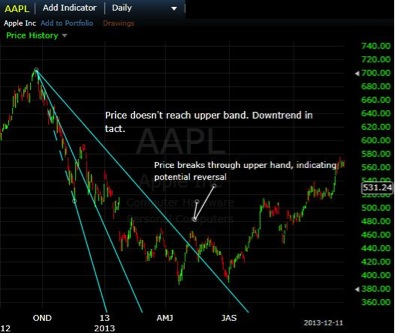
Figure 2 shows a strong downtrend in Apple stock (AAPL). In this case, the trend is very steep so the middle line is broken quite quickly, but the price isn’t able reach the upper band. This indicates the downtrend is still intact.
Toward the middle of the chart the upper line is broken. When the price moves completely out of the lines, in the opposite direction of the lines, it indicates a potential reversal. In this case, when the stock broke through that upper line it did mark a turning point as the price began creating higher lows and higher highs from there.
Figure 2. Speed Lines on Apple (AAPL)
Redrawing
Speed lines are like trendlines in that they can be redrawn to provide a “better fit” of the price data.
Compare figure 2 above with figure 3 below. The only difference is that the price low used to create the Speed Lines has been adjusted. This creates a different angle for the speed lines.
Figure 3. Redrawn Speed Lines
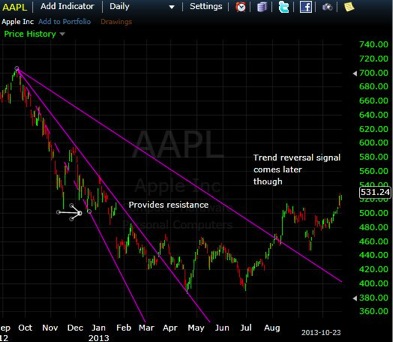
By redrawing, the new middle line provides resistance to the price from January to the middle of March, at which point the price breaks above the middle line.
The lines in figure 2 caught the reversal a bit earlier than in figure 3. Sometimes this will be a benefit, and other times it won’t. This goes to show there is no perfect way to use an indicator.
This is where another indicator or better yet, price analysis can help determine if you should take trades near speed lines, if the Lines should be redrawn or if the trend has reversed.
Final Word
Speed lines are typically used for analysis, although combined with other indicators or price analysis could aid in providing trade signals. Speed lines can be redrawn to accommodate new data, and price should confirm the speed lines. A speed line is confirmed when, after it is drawn, it provides support or resistance. If speed lines are drawn and the price shows absolutely not respect for lines, try redrawing or study to the price action to see if it is potentially too choppy for the lines to be useful. When an indicator isn’t useful don’t keep using it in those conditions; wait for conditions to change or utilize another method of analysis.