Two Strong Trading Days 8/9 ITM!
Trading the channel on July 2, 2013: 4/4 ITM
I started watching the EUR/USD at around 3:30AM EST on Tuesday. If I had started trading about five minutes earlier I would have had a nice call option set-up on the 3:25 candle due to support that had formed earlier on the 2:15-2:25 candles. But with a 3:45 expiry it would have lost anyway so I’m glad I got the extra few minutes of sleep.
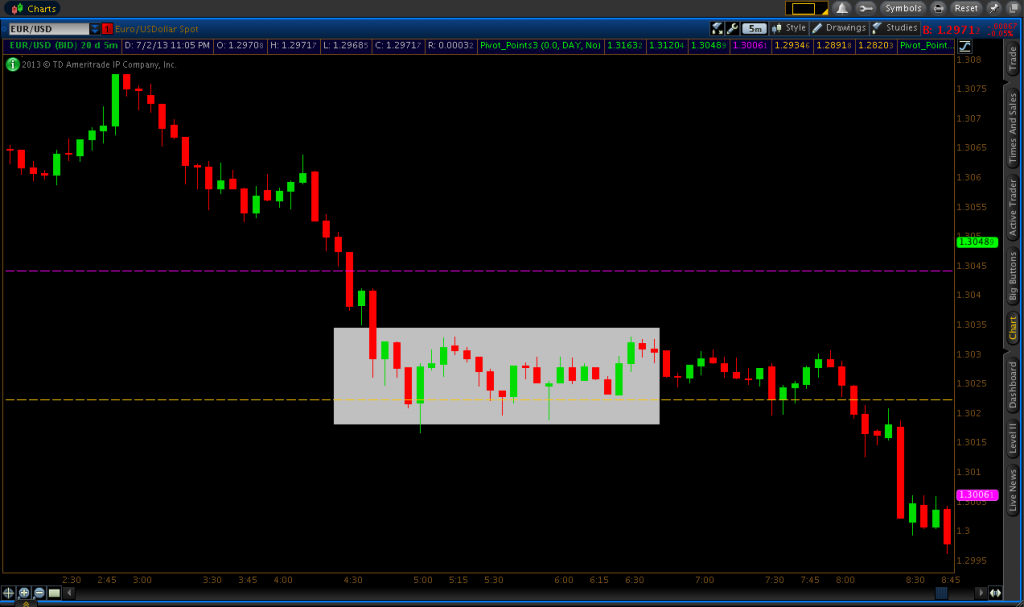
It turned out that all of my trades for the day occurred in the channel that had formed between 4:45-8:00 (white highlighted part in image below). I took two trades at the top of the channel (resistance) and two at the bottom (support).
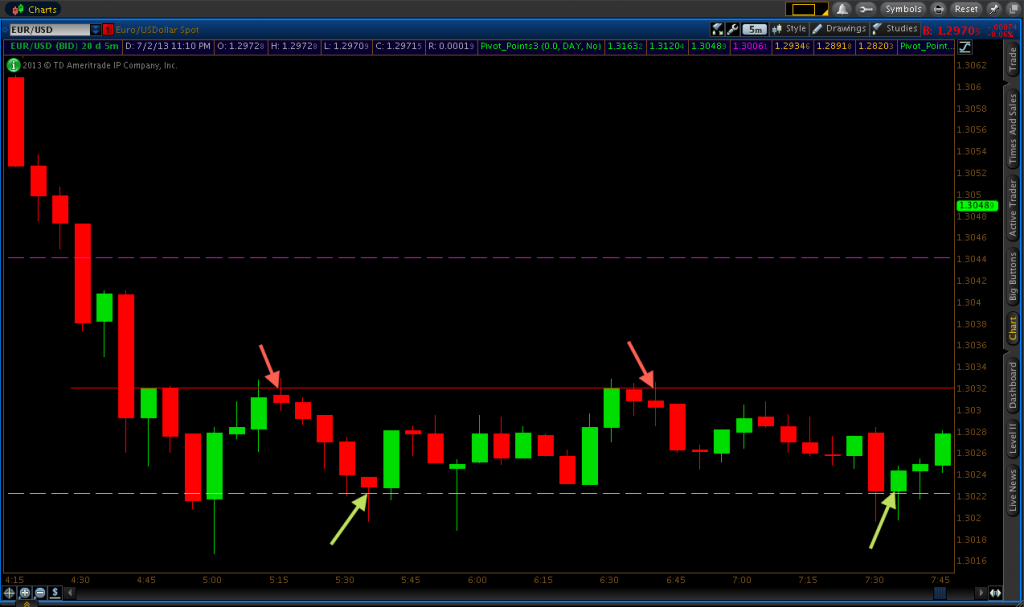
My first trade occurred on the 5:15 candlestick. The market had formed a bit of a weak resistance area on the 4:45 candle before bouncing off the yellow support 1 line (1.30223). When price was retracing back up, I really had no serious intention of taking a trade on the resistance level of 1.30321. Its only foundation was the green candlestick that came after the long red candle that marked the first entry into the channel (for a closer look, see below screenshot images). But I took more notice of it when price bounced off the top red line on the 5:10 candle, so I took a put option on the touch of 1.30321 on the 5:15 candle. I ended up with a really smooth trade, winning by five pips.
I had 1.30223 (support 1) pre-planned for call option set-ups from this point forward. We had seen previous support there earlier from actual price data, helping to solidify its validity as a potential point in the market to take call options. Price did touch 1.30223 on the 5:30 candle and promptly bounced right off. When it re-touched on the 5:35 candle, I took the call option and I viewed it as a very high probability set-up. We had support from previous price history, a daily pivot level, and rejection of the level on the previous candle all going in our favor on this trade. Nonetheless, the trade did spend some of its time in the red, but it eventually closed out as a six-pip winner by expiration.
The support 1 bounce-off that was the main logic behind the previous trade produced only a weak retracement. It did not get back up to our previous resistance level of 1.30321. It simply consolidated in the middle of the channel for a good while before heading back down to support 1. Note that even if a typical touch-reject-retouch set-up had occurred back down at 1.30223 (yellow line), I would not have taken the call option.
I’ve written about this a little bit in my blog before, but I pretty much never take trades that come back down to previous support (or come back up to previous resistance) if it follows a weak retracement. A “weak” retracement means that price never goes back up to previous resistance (or back down to previous support) like it did here. Price simply stalled in the middle of the channel. Usually this is an indication to me that the market will be likely to break below previous support and make trading that level a risky bet. Given the fact that the very important whole number of 1.3000 was lurking only about twenty pips below our support level and the fact that the market was in an overall downtrend for the morning, I thought it was very likely that support 1 would eventually fail. These are simply little nuances of the market that one begins to pick up after watching certain markets over a prolonged period of time.
All of my trade results posts from the past month have been derived from EUR/USD trades. It’s simply an asset that I’m very familiar with and the most comfortable trading. As an added bonus, it often provides the best pay-out on many offshore brokers using the fixed pay-out scheme. Support and resistance based strategies obviously apply and can be very successful with other pairs and with markets outside the forex asset class (e.g., metals, oil, equities). But becoming a so-called expert in a select 1-2 assets can definitely improve the quality of your trading instead of skipping around and trying to become a jack of all trades (and master of none, as the saying goes). If you are watching the charts with an analytical eye and log enough screentime, you will eventually learn quite extensively how an asset moves at a certain time of the day, what price levels in the market it can be sensitive to, perhaps what times to avoid trading the asset altogether, and things of that nature.
Anyway, the market eventually did get back up to our resistance level of 1.30321 on the 6:30 candle. Price rejected the level so I took a put option when it re-touched on the 6:35 candle. This trade was just as strong a set-up as the previous trade, perhaps even more so. I did have some slight reservations that price might head back up to the pivot level (purple line – 1.30441), but the set-up was strong enough such that the odds were definitely in my favor. I ended up with a two-pip winner.
My final trade came back down at support 1 (1.30223). Price dipped below the level on the 7:30 candle, just as it had on four occasions earlier that morning. But like before, the support 1 level held. It closed above the level, and I took a call option trade right around the open of the 7:35 candle. This trade was a bit riskier than the previous two given that it was testing this support 1 level over and over again, the trend was down, and the market figured to give a visit to the huge psychological support at 1.3000. It all seemed so predictable. And, of course, eventually support and resistance level give way to new S/R in the market. But this trade occurred at 7:30AM EST so the U.S. banks and other big money outfits were still largely out of the picture. Therefore, I figured I could potentially get one final bounce out of that level. Fortunately it did and this trade produced about a three-pip winner.
About a half-hour later, though, price finally broke below support 1 and continued all the way down to 1.3000 before bouncing off, as it usually does on an initial touch.
All in all, it turned out to be a very good day. I won all four trades and it all happened just by playing bounces off the top and bottom of the channel with price action confirmation.
Binary Options Trading for July 3, 2013: 4/5 ITM

I had another strong day trading the EUR/USD. I started watching the pair just after 2AM EST and found a trade relatively early on just after 2:30. Earlier in the morning, just after midnight, price had formed a level of consolidation at 1.2974. It came up and rejected the level on the 2:30 candlestick, so I took a put option on the re-touch of 1.2974 on the 2:35 candle. But this trade never went in my favor. It almost came back in the green on the closing candle, but the trade lost by half a pip.
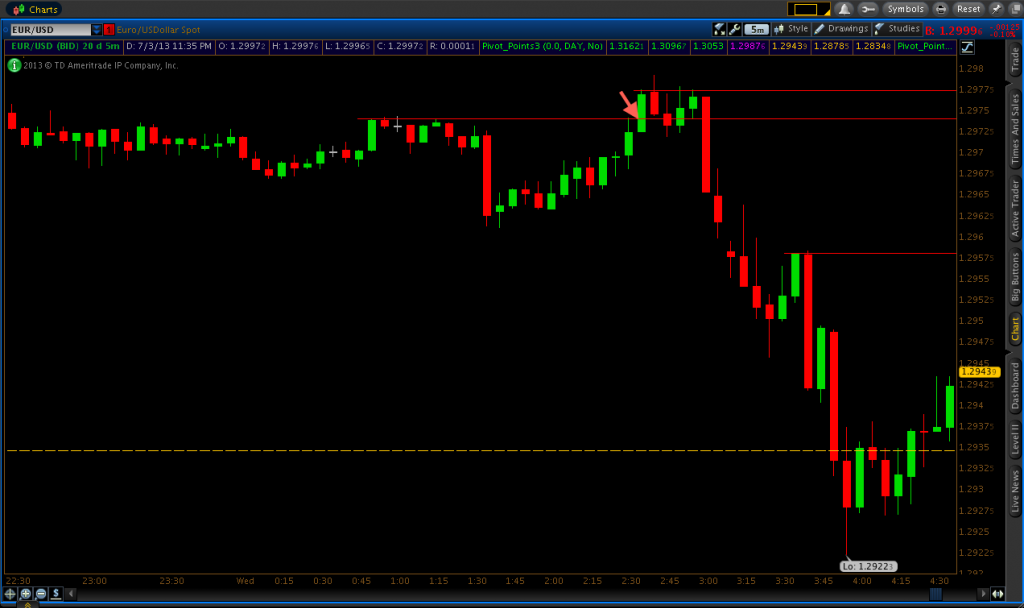
After the big dropoff in price on the 3:00 candle I began targeting 1.29774 (top red line) for put options and 1.29626 for call options, which was the level of support that had been formed around 1:30. It would be several hours before the market would get back up to 1.29774. Price did get down to the 1.29626 support, but nothing materialized at that level exactly to my liking price action-wise so I did not take a trade.
Once price fell below 1.29626 I began looking at that level for potential put options (old support can become new resistance) and the yellow support 1 line (1.29346) for call options. Once again, price touched each of those levels, but I trade quite conservatively and patiently wait for what I judge to be the highest probability set-ups available, so I did not take any trades.
After the market had dropped below support 1 I began looking at that level for possible put option set-ups. And I actually decided to take a put option on the 4:00 candle. I reasoned that the market was obviously significantly downtrending for the morning – fifty pips in about an hour-and-a-half – and would show some sensitivity to the support 1 level as resistance. So I decided to try and ride the current of the ongoing downtrend and took my put option at 1.29346. The trade won by five pips.
I did not take any further trades at support 1 for the day. After my trade, price consolidated in a tight seven-pip channel. While taking another put option at support 1 may have made some sense, it’s risky trying to trade back into such a small channel. The smaller the channel, the sooner price is likely to break out of it. Sometimes it might go in the direction of your trade (if you’re in one), and sometimes it might not. And, of course, in binary options you want to avoid 50-50 trades as much as possible, as it essentially equates to gambling.
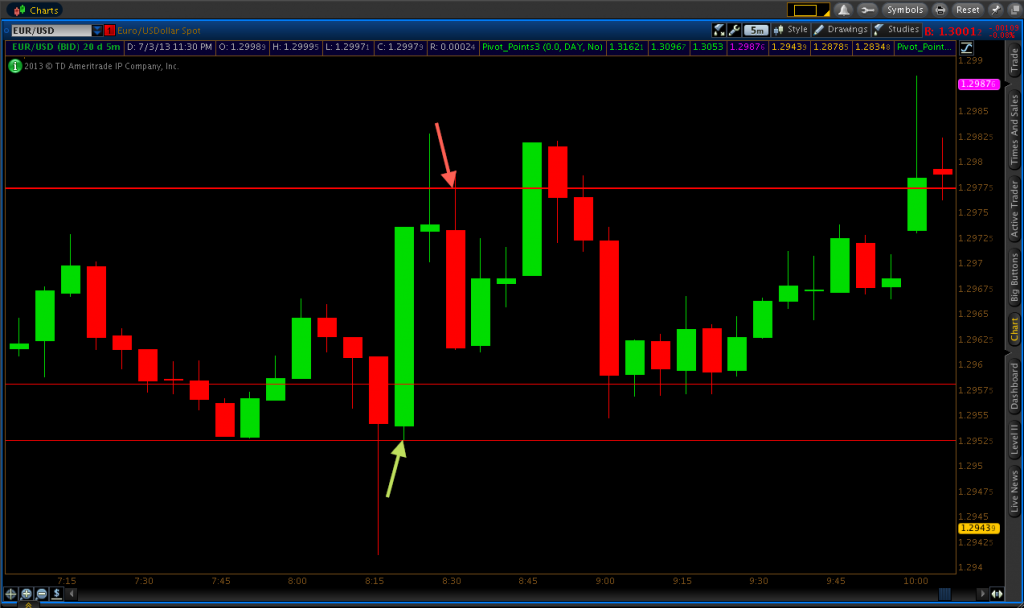
My next trade came back up at 1.29581. This turned out to be more of a price action trade than a support/resistance type of play. I did have that level marked off due to a weak resistance level that had formed at around 3:30. But I wasn’t crazy about the trade until the nice hammer/doji-ish candlestick that had formed on the 5:05 candle. The Euro had been regaining some of its losses against the USD for the past hour, but after that candle formed at that area of resistance, it seemed like a logical place for the market the reverse its direction. I ended up taking a trade on the 5:10 candle at 1.29581, which turned into a bearish engulfing pattern. The market did come back up to test the level of entry again, but it promptly dropped off and closed out as a six-pip winner.
It took me a while after that to find another trade, as once again nothing was really setting up to my liking. I even stopped watching the market for a while at around 7:00, but I observed that a double bottom pattern had formed from the price action at 6:50 and 7:45 (price level: 1.29526). Price came back down and busted through that level on the 8:15 candle before climbing back above. Although I prefer to avoid trading price levels that experienced false breaks as much as possible, I felt that this trade had enough going for it to consider a call option on the retouch of 1.29526, which occurred on the 8:20 candle. This was a relatively short trade (less than ten minutes between entry and expiry), but it turned into one of the best winners I’ve had in a very long time. I was up by thirty pips at one point before it closed out as a 21-pip winner. It’s always nice to experience those types of big winning trades.
My final trade came about five minutes after the expiry of the previous trade. You can notice from the first image embedded in this post, that I had a resistance level form at roughly 1.29774 from 2:40-3:00 (top red line). The market finally revisited that level on the 8:25 candle, and rejected it. With the subsequent touch of 1.29774 on the 8:30 candle I took a put option for an 8:45 expiry. This trade started out very well just like the previous one, going up over fifteen pips in favor before closing out as a nine-pip winner.
I will also be active in the new forums here at binaryoptions.net. I have a strategy thread available there. So far in that thread, I have trade screenshots posted from the blog articles I have here. But if you have questions or comments or any trading-related concerns that you would like me to address, please feel free to let me know there.