Two Rules For Trading With Oscillators
Oscillators are among the most common and widely used technical indicators. That is because this type of analysis can be applied to any time frame, any asset class and even to other indicators. For the uninitiated, an oscillator is an indicator that displays beneath a chart and appears as a wavy line moving above and below zero, or between two extremes. There are many kinds of oscillators, some are better than others, but they all share some basic characteristics regardless of how they are derived. For one, they are all displayed in similar fashion, the wavy line between two extremes. Second, they all provide a wide range of signals including entry points, support, resistance, potential reversals and potential break outs. One of the biggest benefits of an oscillator is that it can be used to give bullish and bearish signals. However, that benefit can be a two edged sword if not applied correctly.
- By definition an oscillator is the repetitive variance about a central point or point of equilibrium over time or between two opposite states. In the case of technical analysis these two opposite states are Overbought and Oversold. If a market is Overbought selling and a falling market could be expected. If a market is Oversold buying and a rising market may be expected. The zero line, or mid point, can be equated to market balance. When an oscillator crosses the mid point the balance is shifting from buyers to sellers or vice versa.
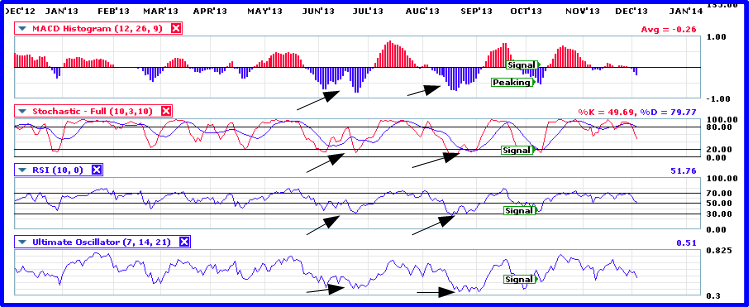
In essence, an oscillator is an EKG of the market. An EKG is an electrical reading of your hearts out put and displays on a graph. The graph tells the story of your hearts health; a specialist can read volumes from that graph. Such is the case with oscillators. Some common types frequently used include Stochastic, RSI, MACD and many many more. I have even discovered a stochastic RSI which applies stochastic analysis to RSI readings but more on that in a future post. Stochastic is based on random walk theory and Brownian Motion. It assumes that short market movement is random and unpredictable. By analyzing that randomness over a set time period patterns emerge and longer term direction can be determined. MACD is based on a pair of moving averages, one shorter term, one longer term. The indicator measures the movement of the short term moving average in relation to the longer one providing an insight into market strength. RSI measures the strength of the market versus previous strength and weakness.
Look at the graphic below. I have a stack of oscillators including stochastic, MACD, RSI and one I have found called the Ultimate Oscillator. You can see that there are many similarities. Each provides a unique view of the markets but in the end they all give off similar signals. You can see from where I have drawn my arrows just how similar they are. My advice to new traders is to pick 1 or 2 of this type of indicator, it doesn’t matter which ones, and learn them inside and out. Choose the ones that look good to you, the ones whose lines speak to you. I use MACD and stochastic because they are the ones I learned first and know best. I have been using them so long I can read them like a book.
How To Use An Oscillator
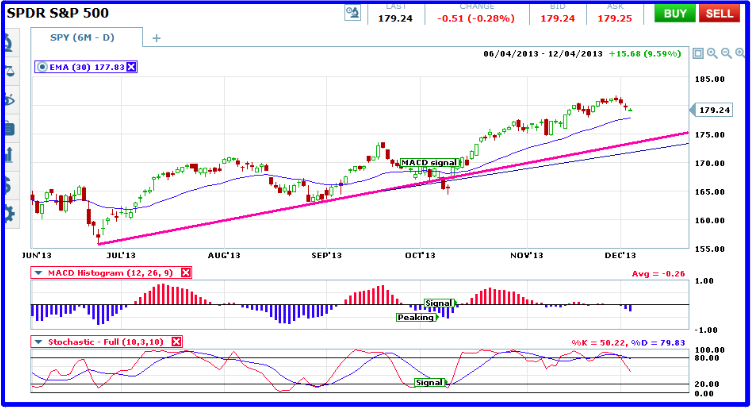
The most basic and reliable signal an oscillator can give is the trend following signal. For this reason it is necessary to establish trend first. Oscillators will also work in range bound conditions but I will get to that in a minute. Because these indicators can give signals in both directions the first rule in using them is to only take signals that follow the trend. In an uptrend a buy signal is when the oscillator moves lower in the range and makes a dip. This dip will not always move down into the oversold territory, the trick is to read the dips in relation to other analysis such as support, resistance or fundamental changes. Sometimes, in a strongly trending market, a dip may very shallow and barely move out of the OB/OS extreme. On the chart below the 6 trend following bull signal resulted in more than $43 of movement on the SPY, an 83% win ratio and more than enough for binary traders to show a profit. Out of 8 bear signals on this chart four were profitable on a short term basis, yielding a net gain of $25 and a losing win ratio of only 50%. The bear signals, in this instance, in both stochastic and MACD, are better used as confirmations of support along the trend line.
- Rule Number One – Only use trend following signals.
Oscillators can also be used with ranging assets. The beauty of this technique is that it is possible to use both bullish and bearish signals. As the assets moves up towards the top of the range the oscillators will provide bullish signals until it reaches resistance. At that point observant traders can then await a bear signal and trade the reverse position with the lower end of the range as a target. The same is true in reverse. This technique is a little more risky because it can provide more false signals. Breaks above and below the range are not uncommon and should only be traded on with a firm confirmation.
- Rule Number Two – Beware false break outs when an asset is ranging.