Trend Analysis For Short Term Traders
Trend analysis is a very valuable tool and at the heart of many strategies in use today. In a previous article, Introduction To Trend Analysis, I described the underlying trends that drive the markets such as the secular, primary and secondary trends. The secular trend is a measure of the economy and society as a whole and covers many years, usually 10 to 15. The primary trend is much shorter, only 3-5 years, and measures a more current view of how “things” are in the market. Let’s face it though, both of these trends are just about useless for a binary trader except in an academic sense. It is important to understand them, know what they means and keep them in mind when analyzing charts but how many signals do you get from the secular and long term trend each year? Not very many. I know that most of you out there are trading super short term 60 seconds (not recommended) and other near term options like 15 minute, one hour and end of the day. Trend analysis is just as important to you as to any other trader, you just have to apply it correctly.
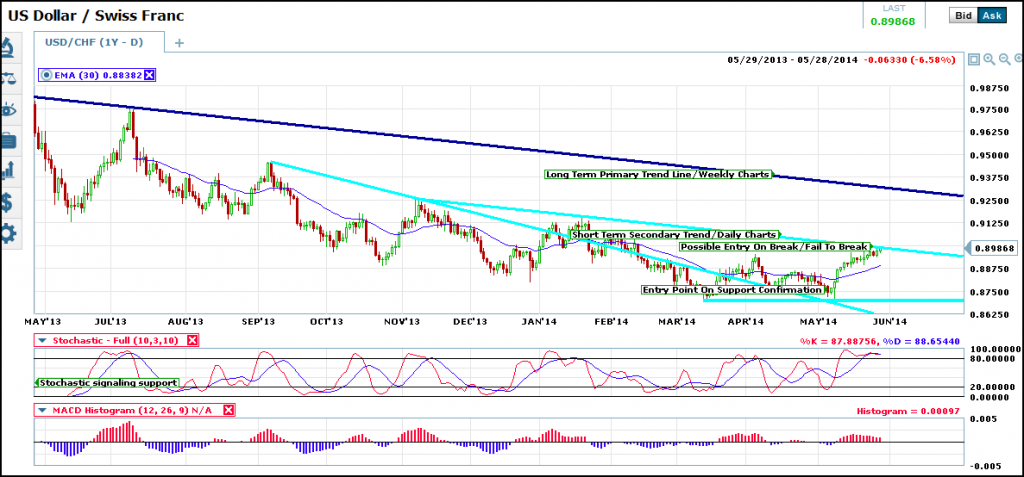
The thing to keep in mind about the secular and long term trends is that they can often and usually do act as barriers, extremes and boundaries for the more mundane week to week and day to day movements of the market. This is why it is so important to understand trend from the top down. I always start my analysis from the weekly, sometimes monthly charts in order to keep things in perspective and often refer back to them to be sure by logic is sound.
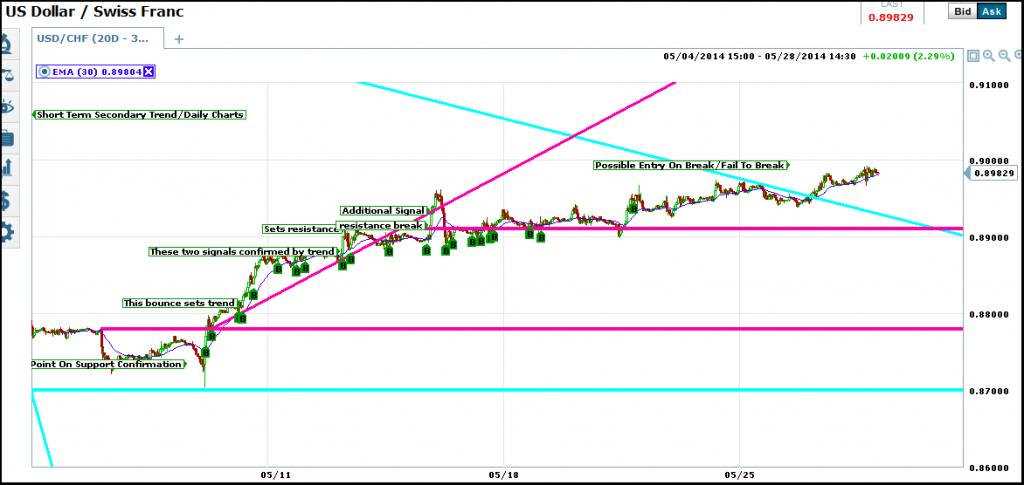
Questions to consider include;Is the market moving up or down along or near a long term trend line, support line or resistance? What does the moving average look like? Is price over or under the moving average? All questions relevant for the shorter term day trader as well as the long term investor. As a day trader, if prices are bouncing from a confirmed area of long term support on a daily or weekly chart then I would assume that the trend is up, in a shorter time frame. The same is true if prices are moving down from resistance in a long term downtrend. Look at the chart below. After the USD/CHF break the first short term secondary trend line it confirms support with a nice trio of candles. This is a signal for a short term trader to begin looking for signals on a shorter term chart. This signal to look for signals is good until the asset prices meets resistance.
Looking above you can see that the short term trend and the daily chart give off only one or two signals on it’s own between the support confirmation of early May and when price reaches resistance later that month. Looking below you can see that a savvy day trader could have made several, if not dozens, of entries in that time using a shorter time frame chart. This is a chart of 30 minute closing, you can use one hour, 4 hour or 15 minute if you like, the point is to harness the power of longer term trends with a shorter term time frame. In my example I simply use a 30 bar EMA for entries and came up with nearly two dozen before I stopped counting. Any and all types of analysis can be used on the market in this time frame to gain signals once you establish the parameters of the trade. What the general direction is, where price is moving from and where it is moving to.
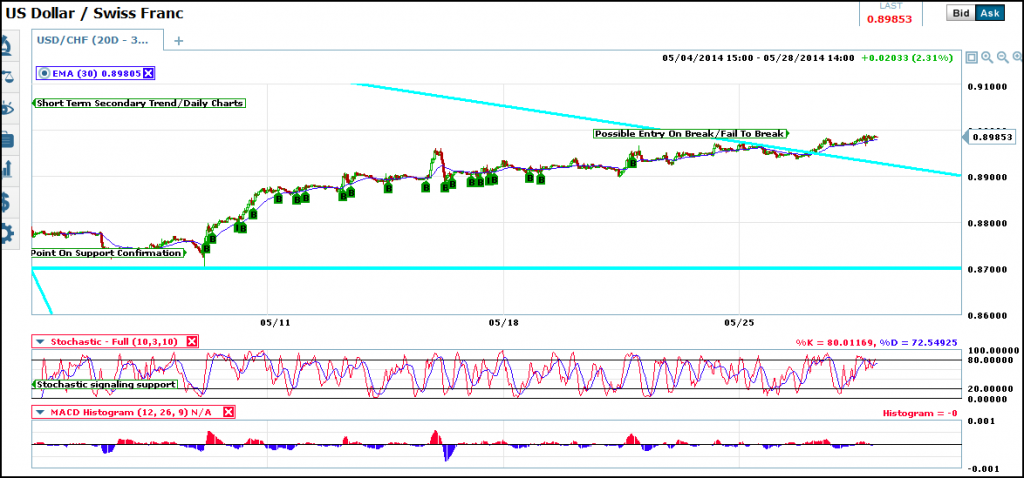
In this next chart I take the analysis a step further with the addition of near term trend lines, support and resistance. The addition of these lines helps to pinpoint the best entries on the 30 minute chart and even sets up additional entries not found with the moving average along. Not only that, the chart can now be adjusted to an even shorter time frame such as 15 or 5 minutes to achieve even more, shorter term, entries. The rule is to use the longer term charts to set parameters of your trade such as where the limits of a movement might be, whether a limit is being tested or broken and what direction prices are moving in while between two limits and then to use those parameters to help find trades in shorter time frames.
Expiry And Time Frame
Each time you take a step down in time frame you need to adjust your expiry to match. The key to pinpointing expiry lies with the trend and the time frame. How many bars does it take for the average signal to move into the money? This number, times the length of the candle or bar is one good way to choose. On the charts here, 30 minute charts, most of the signal move into the money within one or two candles so expiry of 30 minutes to one hour up to 4 hours or even end of the day would be OK, depending on the signal and its relation to near, short and long term resistance.