Trading with Keltner Channels
The Keltner channel is a useful chart tool that helps you gauge the strength of trends, spot reversals and provide an overall context for how the market is moving.
Keltner Channels
Keltner channels are a volatility based indicator which forms a channel around the price. The channel moves with price. This is accomplished by applying a moving average to the price and then creating a channel by adding/subtract an Average True Range (ATR) multiplier to/from the moving average.
When applying the indicator to your chart, there are a couple variables you can adjust. The first is how many periods you want the indicator to look at. 20 periods is common, and will thus calculate the moving average for the last 20 bars, regardless of whether they are 1-minute or daily price bars.
Next we need to choose an ATR Multiplier: 2, 2.5 and 3 are all common. This means that the upper and lower band will be 2 (or 2.5 or 3) Average True Range measures away from the moving average.
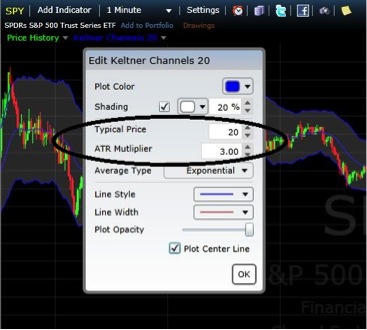
Figure 1. Keltner Settings
 Source: freestockcharts.com
In figure 1 you can see the settings, and how they can be adjusted. In the background you can also see how the Keltner channels look on a chart.
Interpreting Keltner Channels
Most of the price action will fall inside the channel. So when the price reaches the upper or lower channel bands, it is potentially important.
- If the price reaches the upper band it shows strength. If the trend is up, this helps confirm the uptrend. If the trend was down, the price reaching the upper band signals the downtrend may be over.
- If the price reaches the lower band it shows weakness. If the trend is down, this helps confirm the downtrend. If the trend was up, the price reaching the lower band signals the uptrend may be over.
There is also a middle line, which is our moving average. This can also be used to assess the strength of price moves.
- If during a downtrend the price isn’t moving much past the middle line on pullbacks, it shows there isn’t a lot of buying interest, and confirms the downtrend.
- If during an uptrend the price isn’t moving much past the middle line on pullbacks, it shows there isn’t a lot of selling interest, and confirms the uptrend.
Figure two shows these concepts on the 2-minute chart of the S&P 500.
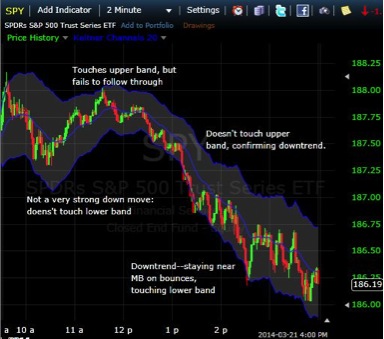
Figure 2. Keltner Channel on 2-Minute S&P 500 ETF
Source: freestockcharts.com
No indicator is perfect, so we should also utilize price analysis to aid us in our trading decisions.
That said, Keltner Channels are useful. Simply, the angle of channel helps establish the direction of the trend.
At the left hand side of figure 2 the market opens and price gyrates around. The move down isn’t strong enough to reach the lower band. The move higher does reach the upper band at about 11:30 but fails to follow-through (and is still below the morning high). The price then makes short-term lower-lows and continues to slide down. The Keltner channel would have help highlight the downtrend. The price wasn’t able to push much past the middle line, indicating little buying interest as it moved lower through the afternoon.
Keltner channels are similar to Bollinger Bands. For a trading strategy you can utilize using either Bollinger Bands or Keltner Channels, see: Strategy for Trading Strong Trends in the EURUSD (or any market)
Final Word
Keltner channel are a useful tool for both new and experienced traders. For new traders they may help highlight the current trend and spot reversals. More experienced traders may use them to gauge market strength. Strong pushes to either the upper or lower band are noteworthy. No indicator is perfect though, so use price analysis as well to aid your trading decisions.