Trading Trend Reversal Chart Patterns
Once a trend has run its course, it often displays certain price movements or patterns which signal a reverse is potentially underway. These chart patterns can be used to get you into the emerging trend early, or get you out of (or avoid) trades which could potentially start to lose you money. Chart patterns are divided into two categories: “continuation” and “reversal.” These labels are deceiving though. Don’t assume that just because you see a reversal pattern, discussed below, that the market will reverse. The pattern must first complete and then follow-through in the anticipated direction in order for the pattern to be valid. Therefore, some patience is required when trading these patterns, but once you understand them, you will see lots of them and can hopefully make a profit from trading them.
Head and Shoulders
The H&S pattern is considered a reversal pattern because it shows that buying pressure is waning. The pattern is created by the price rallying, then pulling back, creating a new high, pulling back and then rallying to a lower high before decline again. For trading purposes, it works best when you see this pattern after a sustained trend higher in prices.
Figure 1. NZD/USD 30 Minute Chart
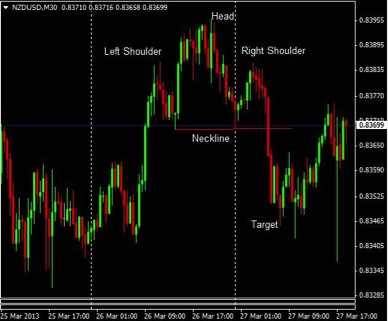
Source: Oanda – MetaTrader
Figure 1 shows the pattern as it plays out in the NZD/USD currency pair. A “neckline” is also shown. It connects the lows of the two pullbacks. The pattern is complete when the price drops below this neckline. Alternatively, the pattern is also considered complete when it drops below the low of the second pullback. The alternative is useful when the pullbacks don’t move to similar levels, resulting in a severely angled neckline, which is of little use.
To trade the pattern buy a put/short/sell as the price drops below the neckline or the second pullback low.
If trading anything other than binary options, place a stop above the right shoulder (some traders prefer to use the head, but I believe this is too much risk for the expected reward). Your profit target is calculated by taking the difference between the top of the head and the low of the pattern. If the pullbacks reached drastically different levels, use an average of the two as your “low” for this calculation. In figure 1, the high of the head is 0.8395 (rounded down) and the low is 0.8370 (rounded up) for a difference of 25 pips. Subtract this from the breakout price of 0.8370 to get the target price of 0.8345, which was hit a couple hours after the breakout in this case.
Inverse Head and Shoulders
The inverse H&S pattern has all the same characteristics (entry, stop and profit target) as the normal H&S, but the inverse pattern should occur after a sustained trend lower, and indicates a price reversal higher.
Figure 2. GBP/JPY Daily Chart
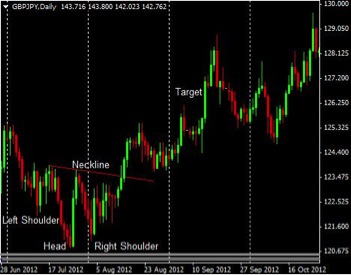
Source: Oanda – MetaTrader
Buy a call option or enter long other trading instruments as the price passes above the second pullback high or crosses above the neckline.
A stop is placed below the right shoulder, if required. The profit target is the high of the formation (or an average of the two pullbacks if it is very different from the first pullback) minus the price low of the head. In this case we get 293 pips which is added to either the neckline, second pullback high or overall pattern high. The profit target was reached regardless of the method chosen in this example.
Double and Triple Tops
The triple top is very similar to the H&S pattern, except with the triple top all three peaks reach a similar level. A double top is also quite similar, except it has only two price peaks which reach roughly the same level. Double and triple tops are complete when the price moves below the price lows of the pullbacks which occurred in the pattern. For trading purposes, it works best when you see this pattern after a sustained trend higher in prices.
Figure 3. Gold (XAU/USD) Daily Chart
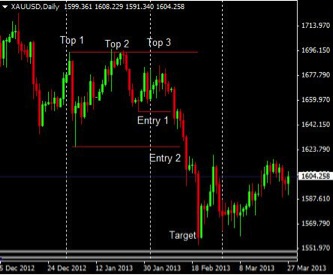 Source: Oanda – MetaTrader
Figure 3 shows a double and triple top. Top 3 is slightly lower than the other tops, so Top 1 and 2 can be considered a double top. Patterns are not always perfect though, and tops rarely reach the exact same level, therefore, if you see this type of price action it can also be considered a triple top.
Two entry points are marked. Buy puts/short or sell when the price drops below the low of a double top. With a triple top there are two low points, I almost always go short when the price drops below the second pullback low (Entry 1 on the chart).
If trading something other than binary options, a stop is placed just above the high of the formation, and the target is calculated using the same method as the H&S. Take the high of the pattern minus the low of the pattern. Subtract this figure from the low of the pattern to get the target.
Double and Triple Bottoms
Flip double and triple tops upside down and you have their bottoming counterparts. For trading purposes, it works best when you see this pattern after a sustained trend lower in prices.
Figure 4. GBPJPY Hourly Chart
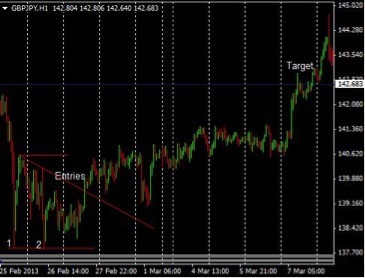
Source: Oanda – MetaTrader
Two bottoms are marked with “1” and “2” on the chart. If a third low had occurred in a similar price area it would have been a triple bottom. Entries occur when the price crosses above the high between the two lows. Alternatively, I drew a trendline along the highs which occurred following the pattern. When the price broke above this it was also a signal to enter long/buy calls. The target was hit, utilizing the method outlined in pervious sections, but in this case took about 9 trading days to do so.
Final Word
Take time to practice looking for these patterns and then watching how the market responds after they complete (breakout). In the real-world patterns don’t always appear perfectly, but you can still trade an imperfect pattern. As long as the overall structure of the chart pattern is there, it can likely be used as a trade signal. The most important thing with trading chart patterns is to wait for it to complete. Don’t make assumptions on the breakout direction before the actual breakout occurs.