Trading 60-second options on the EUR/USD: 6/10 ITM (6 ITM, 3 OTM, 1 ATM)
Like last Monday, I decided to trade some 60-second options. I explained my basic strategy (as it currently stands) when it comes to this form of trading in my first post on the matter here.
For 60-second options posts, I do my commentary a bit differently than usual. Due to the higher than normal volume of trades, I label each trade by number in the screenshot and describe them individually below it. I’ve also marked off individual areas in the market by letter that I wish to discuss, as well.

#1: When I began trading around 2:45AM EST, I had two immediate support levels under where the market was currently trading with the support 1 line at 1.33188 and the 23.6% Fibonacci level at 1.33164 (drawn from the price move 1.20411-1.37104). When price hit the support 1 line I decided to wait and avoid the call option set-up given the 23.6% Fib was directly underneath. When a market is near an important Fibonacci level, it almost always tests it. This is especially important during normal market hours (i.e., when the European and/or U.S. market is open) as banks try to test the liquidity at those levels.
When the market touched the 23.6% Fib on the 2:56 candle, I entered a call option. Price went through a bit before the Fib level expectedly acted as a level of support and sixty seconds from my entry I had a winner.
#2: I took a put option this time looking at the 1.33240 level as resistance. Three wicks had formed at the level and the trend, although pretty much a non-factor thus far, seemed to have a predilection to the downside at this point. So I entered a put option and this trade went in my favor almost the entire time, although it crept back up to an at-the-money trade by expiration (i.e., return of initial investment).
#3: This trade followed the same resistance level as trade #2. After a brief dip, price came back up to 1.3324 where I took a put option, figuring the resistance level would continue to hold and that we’d likely see another test of the support 1 and Fibonacci level. This trade worked very similarly to the last one, going in favor most of the time before a climb back up just before expiration. But fortunately, this trade finished in-the-money by a tenth of a pip.
#4: This trade, quite simply, was a call option using the 23.6% Fibonacci retracement of 1.33164 as support. But the sellers clearly won out at this level and a morning downtrend was confirmed. Although this trade lost, at least the breach of the 23.6% Fib informed me of the general direction the market wanted to go. This certainly helped in making further trading decisions, where I had a clear bias for put options going forward.
I did not take any call options in market area “A” (as labeled in the above screenshot) despite the congestion. Since the trend was down, I wanted to remain partial toward put options.
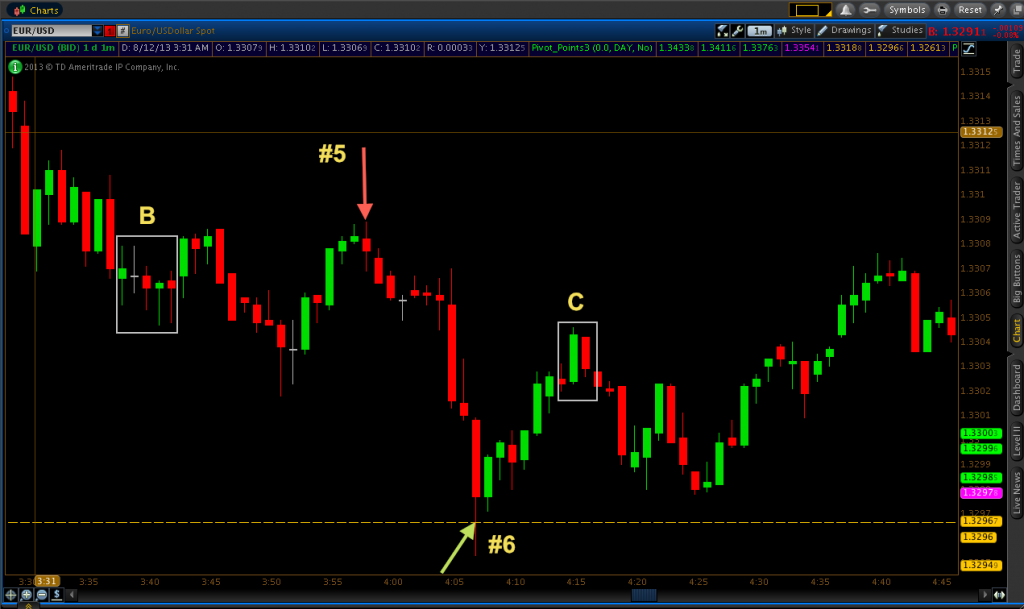
Area “B” holds very similar to area “A” in that it represents an area that could typically act as a support level to look for call options. However, in a downtrend and price only retracing slightly above these areas, I preferred to bypass these call option set-ups.
#5: This trade used the 1.33086 resistance area for a put option set-up. Within a downtrend, retracements back up to resistance levels become higher probability trades. I could have taken the first touch of the level on the 3:57 candle, but to be honest I was slightly unfocused and didn’t realize what I had in front of me. But I was still able to get into the put option on the 3:58 candle and this trade turned out to be a winner.
#6: This call option on the 4:07 candle was purely based on the support 2 level of 1.32966. Indeed, I was disregarding the clear downtrend here and any relatively recent price data, given the EUR/USD hadn’t traded in this range since three trading days prior. Also note that the whole number of 1.33 was disregarded in this case as the market had been trading back and forth through the 1.3300 level frequently lately and was therefore less sensitive to that whole number than it would be in many scenarios.
But when it comes to daily pivot points, the market has a strong tendency to show some reactivity to these since so many buy and sell orders revolve around pivot points. So it’s natural to see some type of bounce, even if it might only be temporary. This trade ended up a winner.
For market area “C” (1.33043) I decided to bypass put option set-ups at that level due to the weak retracements back down to support 2 that came after it. I at least expected there to be another touch of support 2 and perhaps even a move below it if the downtrend was going to sustain itself. But the fact that the market stopped short of support 2 suggested to me that a move back up was likely. This was especially true given that an extremely weak retracement had just occurred right before the re-touch of 1.33043. So no put options were taken at 1.33043. My price feed temporarily froze on that occurrence anyway.

#7: I took the put option on a touch of the resistance level that had been formed around the 1.33069 level. This trade lost by a tenth of a pip. Those type of losses might seem like morale killers, but on 60-second trades outcomes of less than a pip are rather normal.
Regarding market area “D” I did have that area considered for call options, but I was skeptical about the taking a trade there just on gut instinct. First of all, the support level was formed after a three-pip down move from support at 1.33069 and seemed to be just a random low-volume lull in the market. Even so, when that support level came back into play on the 5:05 candle, it went through it right away so I never even really had the chance to take a trade anyway.
For market area “E” I considered that a great area for a put option set-up, but I was simply waiting for price to get up about a pip higher to 1.3303. So that trade never materialized.
#8: This trade was simply another call option at the touch of support 2 (1.32967). The fact that this trade failed immediately does not surprise me as the trend was down and support 2 had already seen a touch earlier in the day. I actually wrote down on paper the flaws in this type of set-up so I can possibly avoid it should similar market scenarios arise in the future.

I did not take trades on market area “F” for the simple reason that I was waiting for the market to retrace back up to support 2 for a better set-up.
I did not take a call option at market area “G” being I was still wary of the ongoing downtrend. For beginning traders, I would always recommend trading in the direction of the ongoing trend as much as possible. Finding high-probability reversals or counter-trend opportunities can be difficult. Even many professional traders choose to never go against the trend on principle. There’s a reason why trend trading has been the most successful general form of trading the markets for several decades.
There was also no trade at market area “H” for the same reason (not wanting to go against the trend).
#9: This was a simple trend-following trade using the 1.32931 resistance level as the basis for a put option. This trade finished in-the-money.
#10: I took a put option here on the touch of support 2 (1.32967). It was my favorite set-up of the day as it went with the prevailing downtrend and was based on a strong level of resistance given it was a pivot level and had seen previous price history earlier in the day. These are my favorite type of trade set-ups in general.
Overall, this was still a profitable day. Since one trade finished at-the-money, I hit on 6/9 trades overall, bringing my aggregate 60-second win total to 74.1%. That’s above the 58.8% ITM rate I need to reach in order to be profitable, assuming fixed-investment money management as I’m currently employing.
Where Do I trade? I trade all my 60 seconds options at Traderush. Fast withdrawals and decent payout %s keep me happy there.