This Is What A Strong Rally Looks Like, And How To Trade It
You Find Bull Markets Where They Are Happening
The hardest part about trading is that all too often the market and/or markets are just meandering. It is only on occasion and for good reasons that markets tend to trend strongly in one direction or the other. That’s why it’s so hard to be a good trader, having the patience to wait for good trends is more than difficult. To add insult to injury, you really need to be able or at least open to trading multiple types of markets, not just forex or commodities or stocks or indices but all of them because you never know where you are going to find the good charts.
Now, the chart I’m about to show you belongs to Tractor Supply Company. Tractor Supply Company is a U.S.-based outdoor lifestyle brand with over 1,800 location in North America. I understand that not all readers will have access to trade this issue but don’t let that turn you away. The chart is good, the analysis clean, so it offers a good learning exercise for all traders.
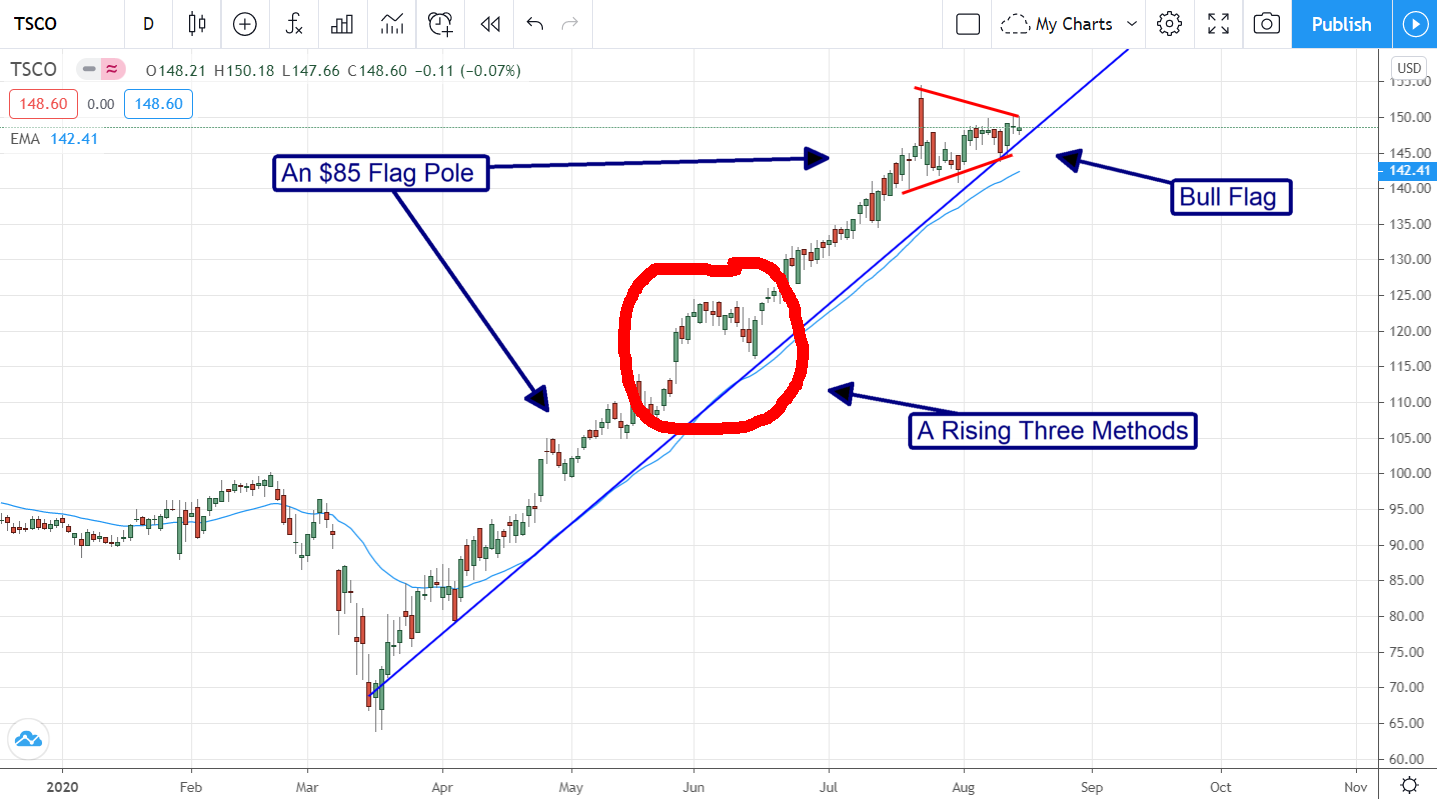
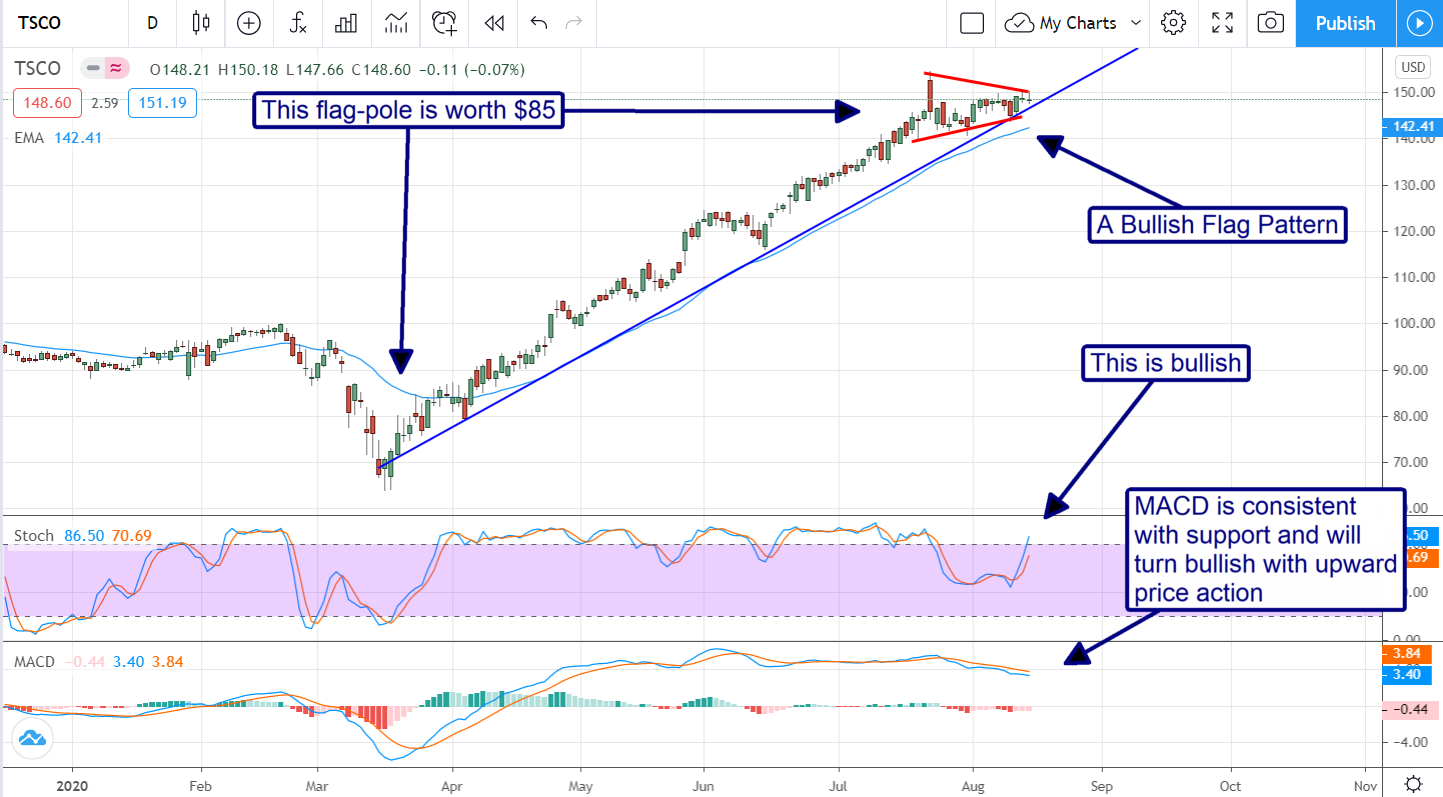
What we are looking at is a strong rally, but only the first half of it. You can see that price action has moved up from the March low in a steady and consistent manner with nothing that looks like more than profit-taking or rotation until the past few weeks. The past few weeks the stock popped on earnings and then entered a consolidation. the consolidation is finding support at high levels and along the up trend line I’ve drawn giving it the appearance of a very tradable signal. The Bullish Flag Pattern.
The Bullish Flag Pattern is so awesome because of many reasons. The first is that it is easily recognizable, it consists of a rally followed by a short triangular shaped consolidation. The second is that it is a sign of continuation. The market is consolidating and rotating getting ready for the next leg higher. Think of it like this, the rally is a train on the move and the conductor is waving a flag telling everyone it’s time to get on board. The third reason is because you can make some pretty accurate projections from the flag. Basically, the flag is about the mid-point of where the market thinks the price should go. What you do is take the magnitude of the rally leading up to the flag which in this case is $85 and add that to the point of the flag. In this case that’s $85 on $150 or about 56% upside.
This pattern can be found in any time frame but the longer-term the chart the better the signal. This pattern can also be found on any asset provided the market is liquid and active. I’d be worried about any asset with low volume or weak trading history. Also of interest, there is a nice little Rising Three Methods on this chart, another great continuation pattern.