This Is How To Tell When The Market Is Bottomed
What Is A Market Bottom And How Do You Know When One Forms
With the equities markets in near-freefall and economic doom on the doorsteps of countries around the world traders are right to wonder if there will ever be a bottom. I am here to tell you that yes, there will be a bottom, and give a little insight into how to know when one is here.
The first step in determining if a bottom is in play is to have a target for your bottom. I went over the basics of support and resistance in my last post, that is a good place to start, so ook for some potential areas of support that look like they might be a bottom. It doesn’t matter if they turn out to be bottoms or not, we’re not going to use those targets as signals only as targets where signals may form. As price approaches each target look for signs of continuation or reversal in the candles. In this example I used weekly charts.
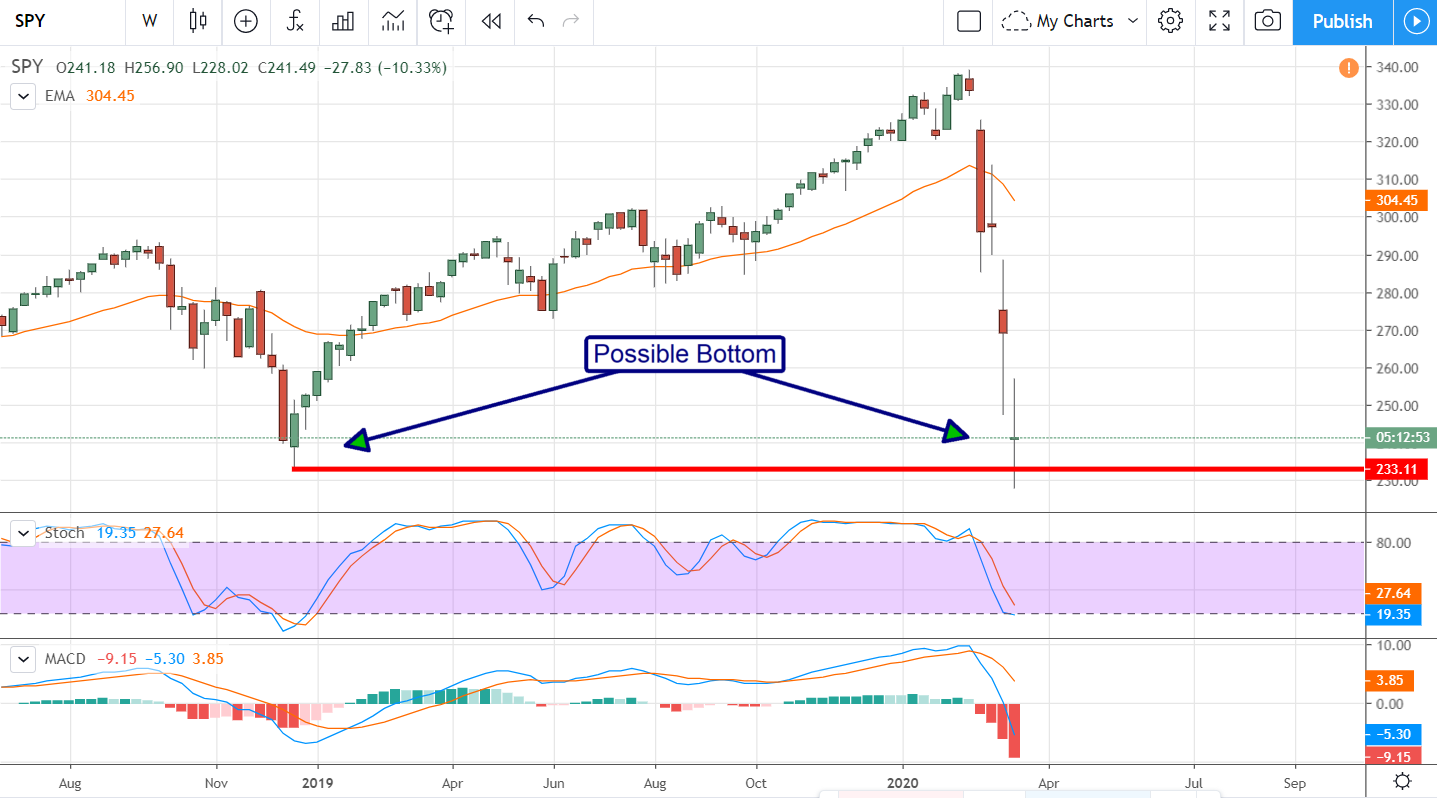
The first bounce is always the hardest to call, the market can fall and fall and fall for a long time, that’s why they call bottom-picking “trying to catch a falling knife”. Too many who’ve tried have had their throats ripped out by the market bears and found themselves worse than broke. However, once the first bounce occurs you can start picking other targets and even making trades. Assuming this week marks a bottom in the SPY S&P 500 Index Tracking ETF, this is what a chart may start to look like. Traders may look into buying calls or selling puts at this level with an idea the trade may only last for a few days.
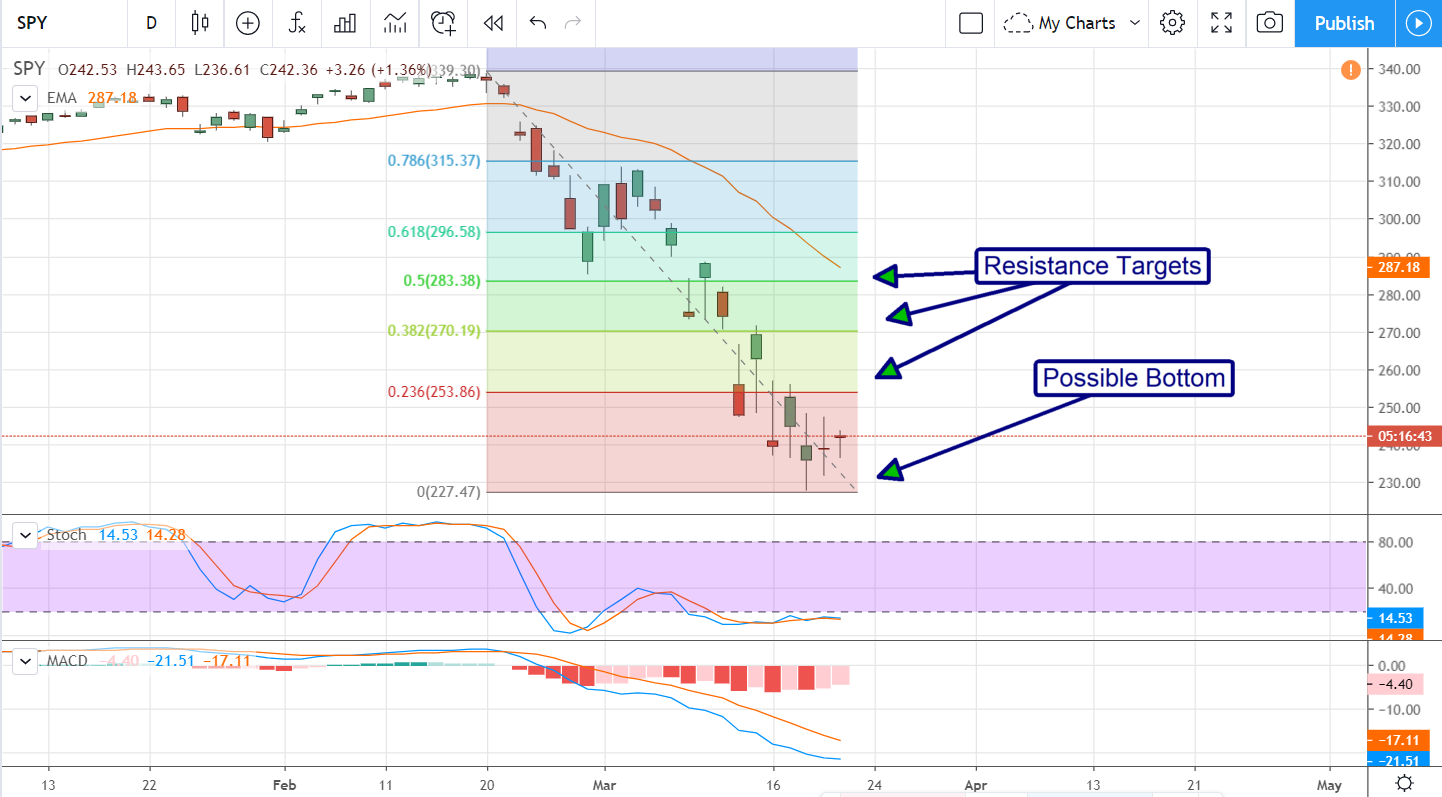
After the first bounce price action will move back up to retest resistance. In this case, resistance is likely to be strong because there are a lot of big losers who were late to first rounds of selling. Because this market is being driven by fear and emotion more than any true fundamental conditions the best choice for resistance targets is the Fibonacci Retracement. Each retracement level is a possible point of resistance, the higher the market gets the better it will be for the bulls longer-term. Regardless, the retracement levels are targets for signals, just like other support and resistance targets, so watch for price action to make a signal before making the next trade. In this example I used daily charts.
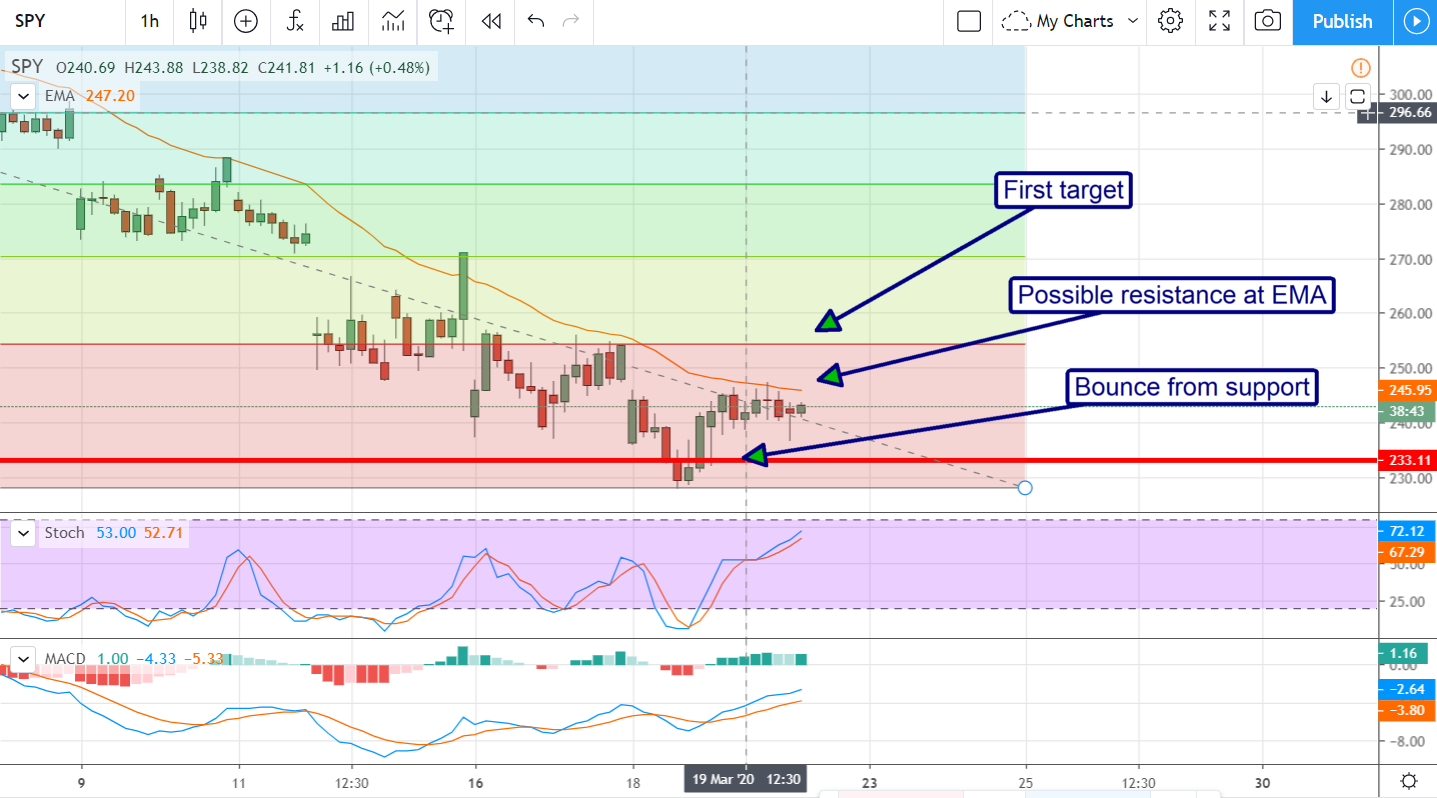
The next trade(s) will be closing the first position and opening an opposite position for the next bearish swing. We can be sure the market is not sold out, only oversold for the moment, so a retest of the low is very likely. The MACD shows a very large extreme peak which also indicates a retest of the low is likely. The question is how low the downswing will be. So long as it doesn’t break through the previous low things are looking good.
So, to answer the question of how to know when a bottom has formed it’s this. You, with as much certainty as you can have as a trader, that a bottom is in place when the reversal is complete. The reversal is complete when the double-bottom confirms with the second bounce. In some cases and this might be one, the reversal is complete after a new low is set and a head-and-shoulders pattern forms. In either case, the real buy signal won’t happen until the baseline of the reversal pattern is broken. Until then, keep your trades small and the leverage low, focus on support and resistance targets, and stay alert for momentum swings.