The S&P 500 Price Forecast For 2020
What To Expect From The S&P In 500
With the Santa Claus Rally in full effect the time to think about 2020 is at hand. The S&P 500 is up more than 28.6% for the year and on track to post the best year in over 20. Much of this year’s gains are attributable to two stocks, Apple and AMD, both surging on rising demand for consumer-related tech and the push for 5G.
The tech-industry sub-index of the S&P 500 is up nearly 50% for the year with Appke and AMD in lead. Shares of Apple are up more than 80% over the last 12 months and sitting at a fresh all time high. AMD is up more than 150% for the year and on the verge of breaking out to new all-time highs.
Selling, Expect To See Selling
While the market is breaking out, there are growing signs of weaknesses that could spell trouble in 2020. The S&P 500 has had a stellar year but is now so far above trend there’s just no reason to keep buying. If anything, the year 2020 could start with a major round of profit-taking. I mean why not? For investment managers who track their performance in profits it only makes sense to start the year with a bang.
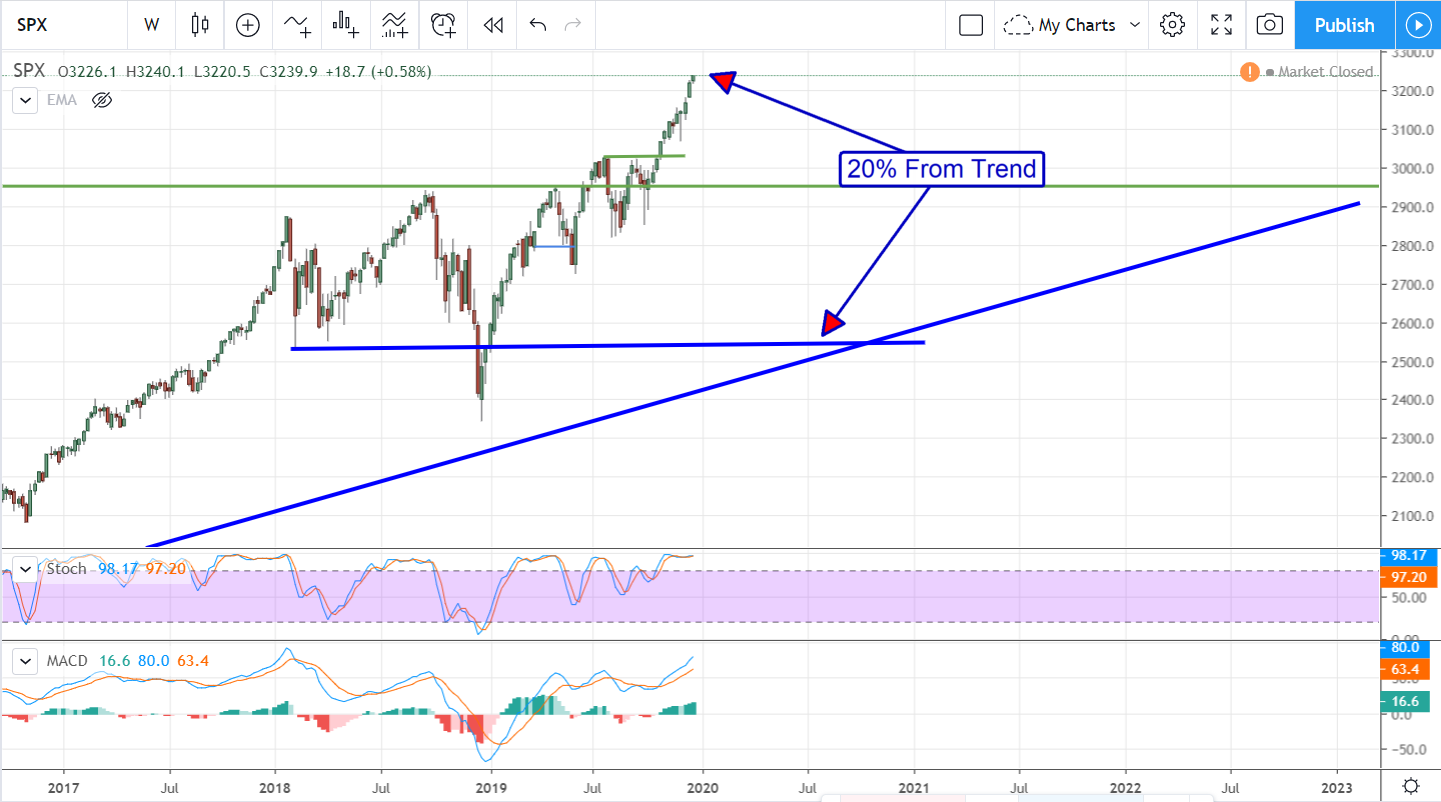
The daily chart of S&P 500 prices puts it all into perspective. The index has surged over the last year, going parabolic, and is far above anything I might call “solid” support. The indicators are also telling. Stochastic is and has been overbought for much of the year, the MACD momentum indicator showing sharp divergence from the new highs. This set up doesn’t guarantee a sell off is brewing but it does set the stage. If prices begin to fall and no positive catalysts emerge the decline could become severe.
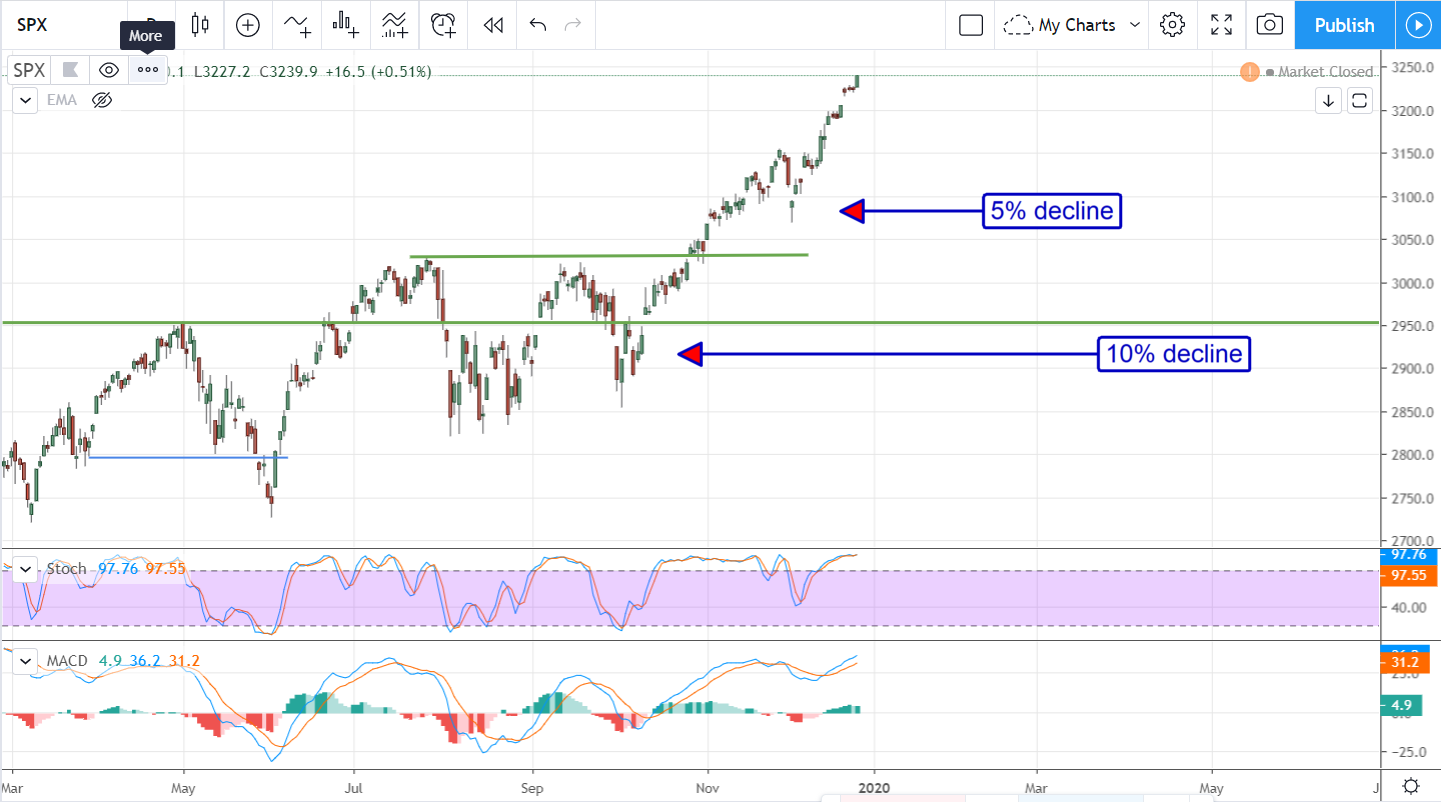
A 5% fall in the index price may find support at the 3078 level but that support level is tenuous. It, too, is well above anything I could call “solid” support and it is grounded firmly in the trade-deal rhetoric. The announced agreement on Phase One Trade Deal issues is the primary cause for the parabolic nature of the current rally. A 10% decline in the index would bring price action down to 2916, below a firm support target at a previous all-time high, and put it in danger of a much deeper decline.
The Long-Term View Is Bullish, But….
The long-term view of the index is still bullish but there is a big red-flag investors need to take heed of. The primary trend in the market is up, but the trend line is still 20% below today’s price action. That’s a large chunk of change for investors and managers to take off the table.
The supporting factor for the trend is economic. The economic conditions in the U.S. are expansionary and stable if not accelerating. The Phase One Trade Deal will aid this but the risk is this; the deal has long been expected, the market has been driven to its highs on those hopes, so once signed a “sell-the-news” event is likely to take place. Add to this the uncertain political environment (the 2020 election is going to be hotly contested by both the Right and the Left) and the odds of a major correction increase.