The Second-Coming Of Bitcoin Is Far From Over
All-Time Highs Across the Board. Binance Coin, Bitcoin, and Ethereum Lead the Charge
by Bogdan Giulvezan
The Crypto Train shifted into high-gear a while back and it seems it’s not going to stop soon. Everything’s green on CoinMarketCap, with the majority of coins posting double-digit gains (percent-wise) almost every day.
As recently as 27 January 2021, Bitcoin was trading below $30,000, having fallen from $40K+ highs, yet now it is trading above $47,300 (small retracement after going above $48,000). Just a week back, we’ve talked about a Golden Cross scenario that was about to unfold and in the meantime, the pattern materialized and worked as anticipated: it brought in more buyers, who took price higher. The previous ATH situated around $42,000 is shattered and Bitcoin is as strong as ever.
Ethereum also posted a new All-Time High but so far it had a constant climb, without major jumps up and down. You know what they say: “Steady wins the race” and it seems as Ethereum is living by this mantra. Currently, it is trading at $1,770, after reaching an ATH just above $1,820. Higher prices to follow? Possibly.
Binance Coin (BNB) has been another amazing performer, basically since its inception. However, this year the coin has been on fire! Trading around $36 in the first days of 2021, BNB managed to climb to $75 on the 5th of February, and now, only 7 days later, it’s trading at $124, coming from highs at $140+. We could go as far as saying that BNB’s chart is the very definition of the “To the Moon” meme. It’s simply just going up. But beware: strong moves are prone to pullbacks. You know – what goes up must come down (and vice-versa).
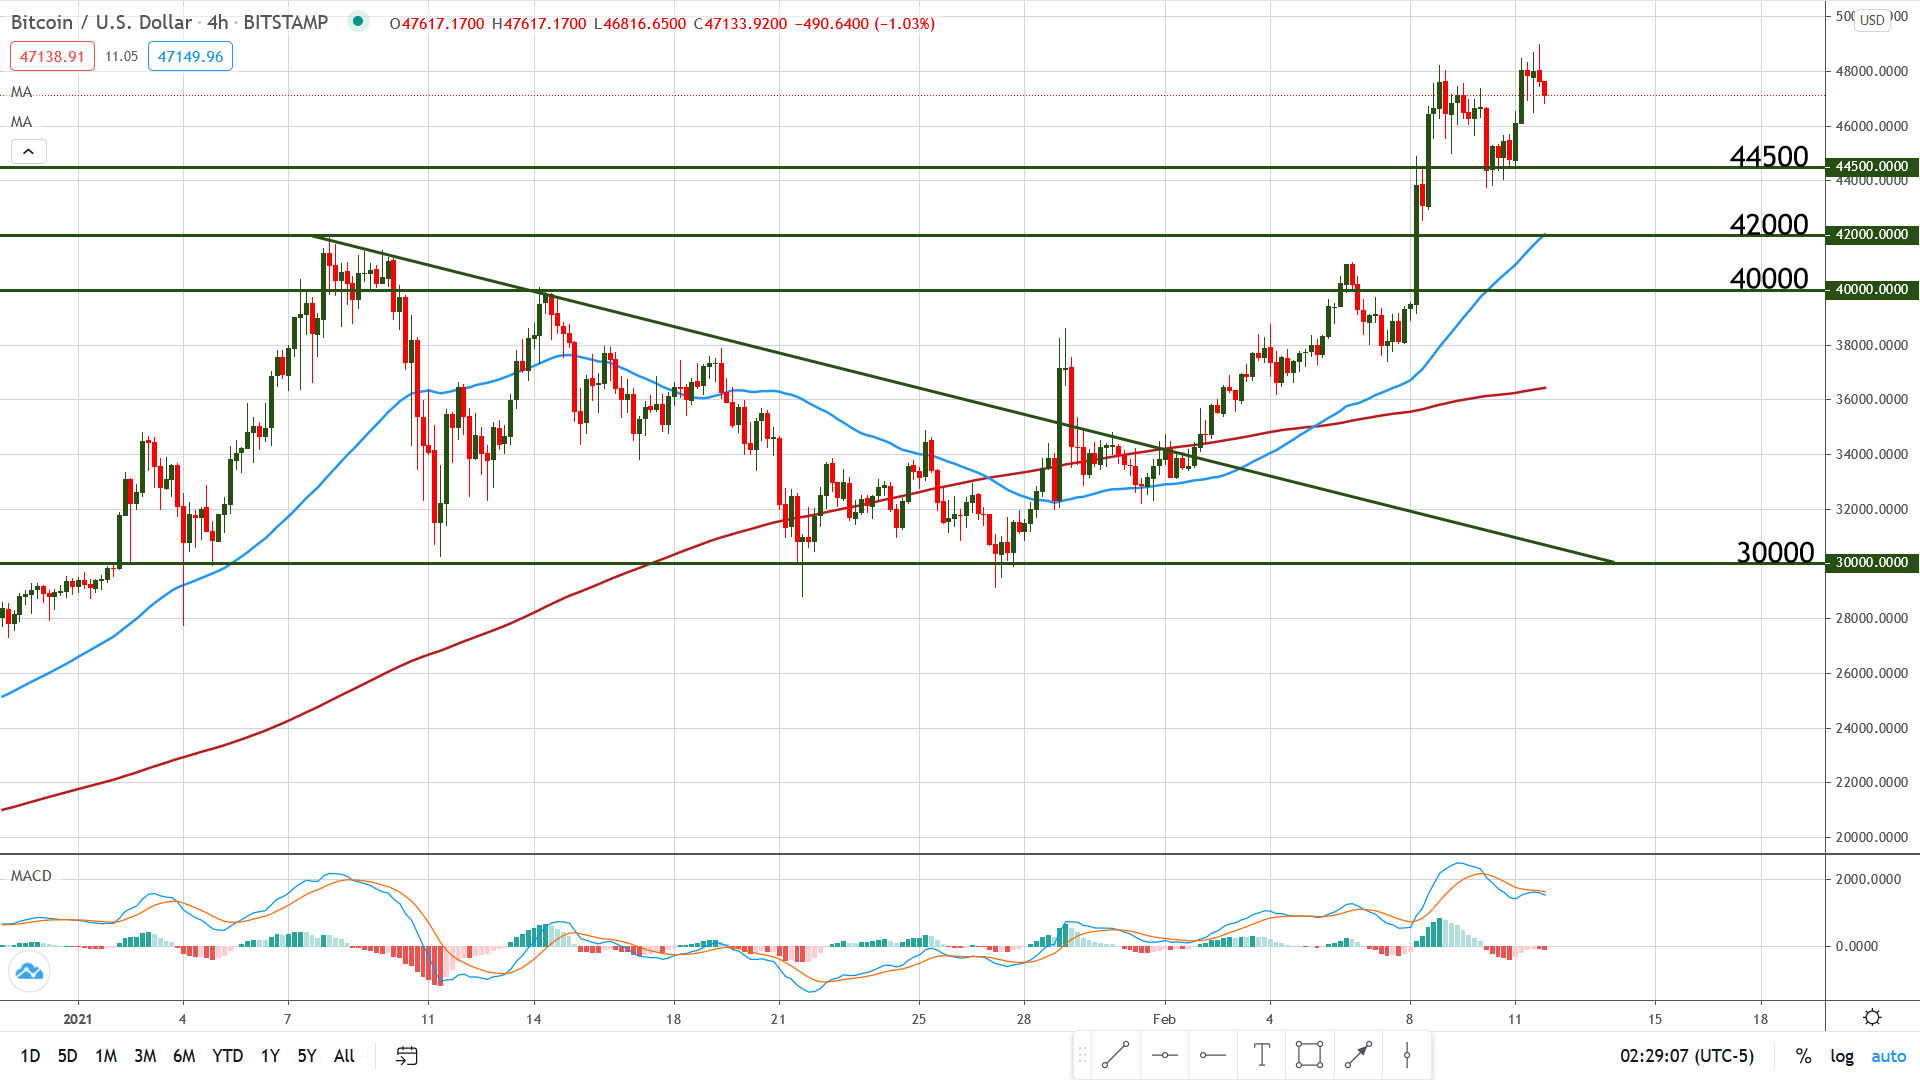
Chart Analysis – BTC/USD
Considering that altcoins usually follow Bitcoin, let’s take a look at the Digital Gold and see where it can go from here. Currently trading at $47,370, Bitcoin surpassed its previous All-Time High reached on 8 January ($42K+) and yesterday it managed to break the new ATH once again, pushing above $48,000.
Looking at the 4H chart below, we can see that $44,500 has become support because it rejected falling prices more than once (several candles tried to close below it but failed). Thus we can expect price to react to this level in the future.
Despite the chart bullishness, we must acknowledge the fact that the new high is already showing signs of a pullback: price just timidly surpassed the previous high and red candles with long wicks are already forming. On top of that, the MACD lines are crossed bearish and moving down. With all this in mind, we may see lower prices, possibly capped by $44,500. If the said support breaks, BTC may have a close encounter with the 50 periods Moving Average (blue line) but the overall bias is bullish.