The Ripple Rocket Lifts Off, Adding Almost 70%
Bitcoin, Ethereum Show Recovery Signs Post Fed Meeting
Following a televised interview delivered by Ripple Labs CEO Brad Garlinghouse, XRP is up almost 30% during the last 24 hours and 67.6% over the last 7 days. The main price driver for Ripple’s XRP has been the lawsuit between the SEC and Ripple, where the former claims that the latter sold $1.3 billion in unregistered securities.
Ripple Labs, on the other hand, claims that XRP fails the Howey Test and thus it cannot be considered a security. In his recent interview, Ripple co-founder Brad Garlinghouse restated the idea that XRP is not a security: “The first step to determinate [whether XRP could] be a security, is you have to have an investment contract. Our point is, Ripple doesn’t have a contract. With whom is the contract? It’s not a written contract, it’s not an oral contract, it’s not an implicit contract.”
During his Fox Business interview, Garlinghouse also stated that the SEC had “lost its way” and was a “cuckoo for cocoa puffs”. As it turns out, this type of flamboyant talk sits well with Ripple investors, as XRP’s price has just hit a high at $0.5588 and is currently trading slightly lower, at 0.5360. Thursday morning, XRP was trading at $0.39.
Bitcoin, Ethereum, and BNB suffered another blow delivered by the Fed in the form of a 75 basis point hike, bringing the federal funds rate in the 3.00% to 3.25% range. At the time of the announcement and during the press conference that followed, BTC, ETH, and BNB dropped but soon after, they started a recovery rally, climbing to pre-Fed levels.
Chart Analysis – BTC/USD
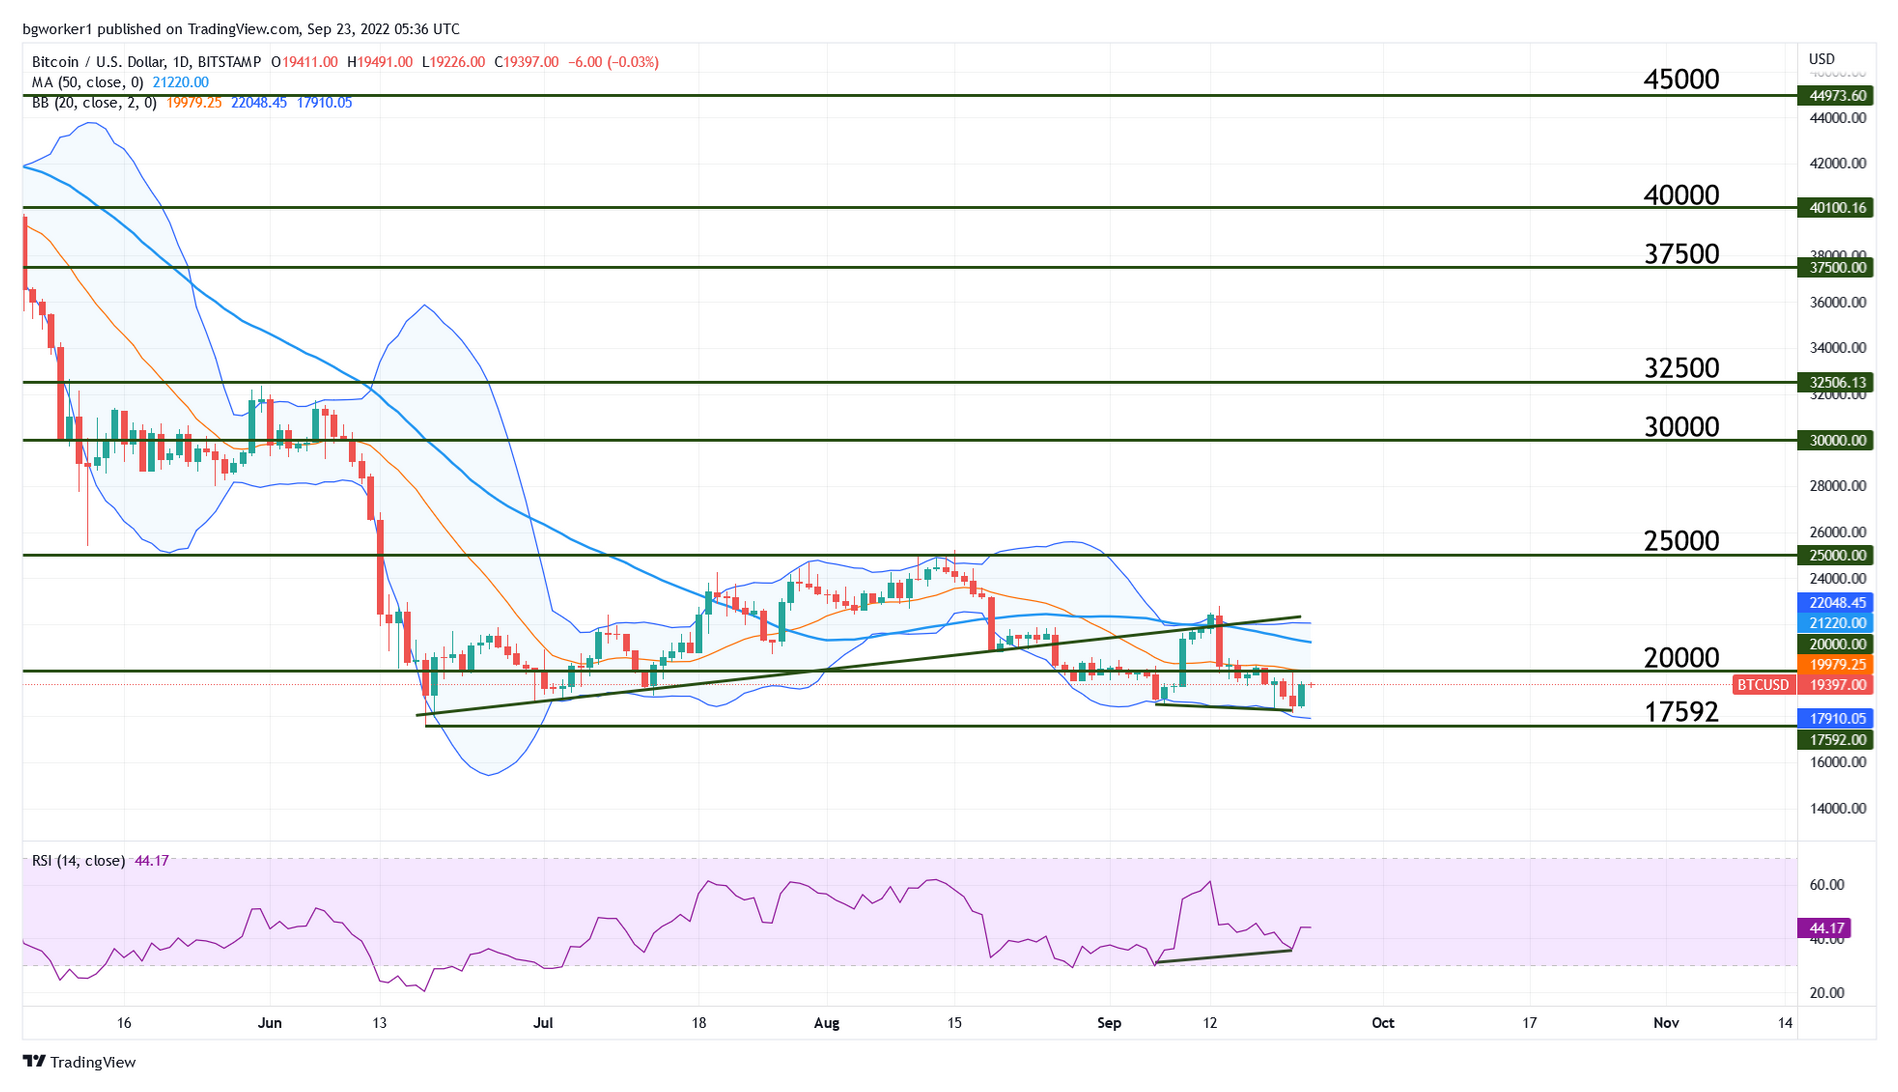
Wednesday evening, Bitcoin touched the infamous $20,000 level but it dropped sharply when the FOMC announced the rate decision. Once things settled down, the apex cryptocurrency started to recover and erased most of the losses. It is currently trading at $19,450.
The pair is lingering at the bottom of the Bollinger Bands and is showing bullish divergence. This type of divergence occurs when the price is making a lower low but the indicator (in this case the RSI) is making a lower high. This is highlighted by the two lines drawn between the corresponding lows of the price and the RSI on the chart below.
Bullish divergence and the positioning of the price at the bottom Bollinger band are good indications that the pair is likely to bounce higher. The first destination in this bullish scenario is the $20,000 level. If that barrier will be broken, the pair may extend its rally towards the top Bollinger band. To the downside, the first barrier is the previous low at $17,592.