The Guppy System; Trading Shark Or Shark Bait
Now that I have come to realize that most websites touting free, reliable, no-risk binary options strategies that work are mostly just a bunch of BS I have started to focus my time more on unearthing strategies you can actually use. Most of the “free” systems really aren’t free, they require registrations and deposits at “trusted brokers” in order to get them. This poses a challenge to traders for two reasons. The first is that you there is usually no information about the system so you can’t evaluate it’s effectiveness and the second is how can you trust a system that relies on your deposits and trade volume to generate income not your profitability. I see a real conflict of interest in that, if the system really works and the providers really care about your success why can’t they just sell the system or make money based on your performance.
One place I have found that is a great resource for free trading strategies and resources are forums. There is a great forum here at BONET but the strategy I am looking at today can be found at BinaryOptionsDaily.com. The strategy is called the The Guppy System. It is based on an array of moving averages ranging from 3 candles out to 150 or more depending on your set up and preferences. The system is based on wave theories and makes good use of the moving averages to produce an easily recognizable signal. One of the things that I like about this system is that is a good one for newbies to start with and provides a platform to build more advanced trading strategies from.
What Is The Guppy System
The Guppy System was first developed by Daryl Guppy and described in his book Trend Trading. To set it up you will need to load 13 moving averages onto your chart. The ones used here are exponential moving averages. Exponential moving averages give added weight to the most recent data which caused them to track price action more closely than a simple moving average. This means that an exponential moving average (EMA) will give more signals than a simple one, and also more false signals. This is why this strategy uses so many moving averages. The averages are 3,5,8,10,12 and 15 all in light blue then 30,35,40,45,50 and 60 all in darker blue so you can tell the two groups apart. The final average is set to 200 and is used to set trend. This one should be colored brown or red in order to keep it separated from the rest. A 150 bar moving average can be substituted for the 200, especially with more active and volatile assets.
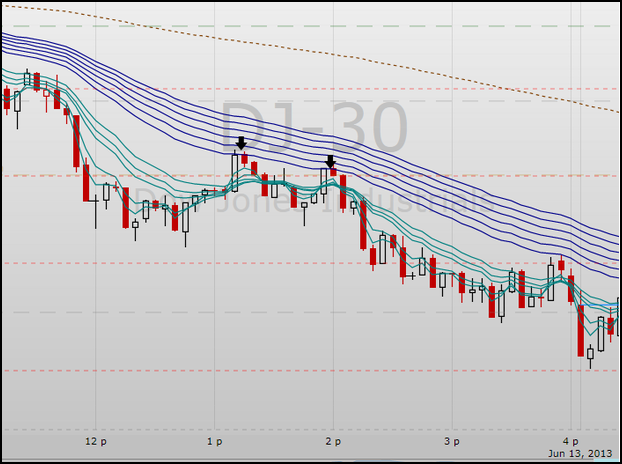
The signals are trend following. Starting with the 200 bar EMA to set the trend only take signals in line with the trend. When the EMA is pointing up or trending up the trend is up, if it is pointing down or trending down the trend is down. Once you establish trend wait for the longer term group of averages, the dark blue, to rollover in line with the trend. Once this happens wait for the shorter term group of averages to rollover in line the the trend as well. The very strongest signals will occur when the longer term group of averages is in line with the trend and completely crossed over so that the averages are in order. Two rules for trading with this strategy given by the author are to avoid trading against the 200 bar EMA and not to trade on shaky crossovers. I will say that you should never trade against the 200 bar moving average and to wait for confirmation before entering a trade. A confirmation would be a strong/definitive break of price above the short term group of moving averages and/or a pull back to retest once a break has happened.
Beware, The Guppy Is A Shark
What time frame to use? The beauty of this strategy is that it can be applied to a number of different time frames and in fact, takes time frame into consideration even though the author doesn’t discuss it. Think about it like this; a 30 bar EMA on the weekly charts is equal to 150 days (30 weeks X 5 days) so it is in fact equal to the 150 bar EMA on a daily chart. The array of averages used here are all short term and expiry should be treated as such but the signals themselves are good because they are in line with trend and time frame. So, back to time frame and which one to use….the author is using 5 minute charts for his examples and this is OK but I think 30 minute or hourly charts would be best for day and day to day traders that want to avoid the market noise present at the 5 minute time frame. I my self trade on the daily and hourly charts and have found this strategy to be effective on both.