The Greenback Rebounds Sharply Ahead Of NFP Data
NFP Data Could Green Light Additional Gains
by Bogdan Giulvezan
April was a rough month for the US Dollar, as the DXY finished the month with a 2% decline; the index was facing a 3% monthly drop but the last day of April saw the greenback rejuvenated and making solid gains against most of its major counterparts.
The US Dollar Index (DXY) tracks the performance of the dollar against 6 other currencies, out of which the Euro has the most “weight”, representing 57.6%. Throughout April, EUR/USD climbed more than 400 pips but lost approximately 100 pips during the last day of the month, as the Dollar bulls received a confidence boost from better than expected U.S. data posted Friday.
The week ahead is of utmost importance for the U.S. employment situation, as the Non-Farm Payrolls report is expected to show that 975K new jobs were created during April.
Key Events for the Week Ahead
The first notable release of the week is scheduled for Monday at 2:00 pm GMT: the ISM Manufacturing PMI, which is a diffusion index derived from the opinions of purchasing managers regarding business conditions in the manufacturing sector. The forecast is 65.0 (previous 64.7) and higher numbers indicate optimism, with the possibility to strengthen the greenback.
Thursday, May 6 at 11:00 am GMT we turn our attention to the Pound charts as the Bank of England will release the Monetary Policy Report, which contains projections for inflation for the next 2 years, as well as the Monetary Policy Summary, which contains the outcome of the rate votes and the reasons that influenced the rate decision. The rate is currently set at 0.10% and no change is anticipated but this cluster of events will probably have an impact on the Pound’s movement and volatility.
The most important event of the week is the release of the Non-Farm Employment Change (aka Non-Farm Payrolls – NFP), which is the main employment data for the U.S. economy. The report comes out Friday, May 7 at 12:30 pm GMT and shows changes in the total number of employed people during April, excluding the farming industry. The anticipated number is 975K, while the previous reading was 916K.
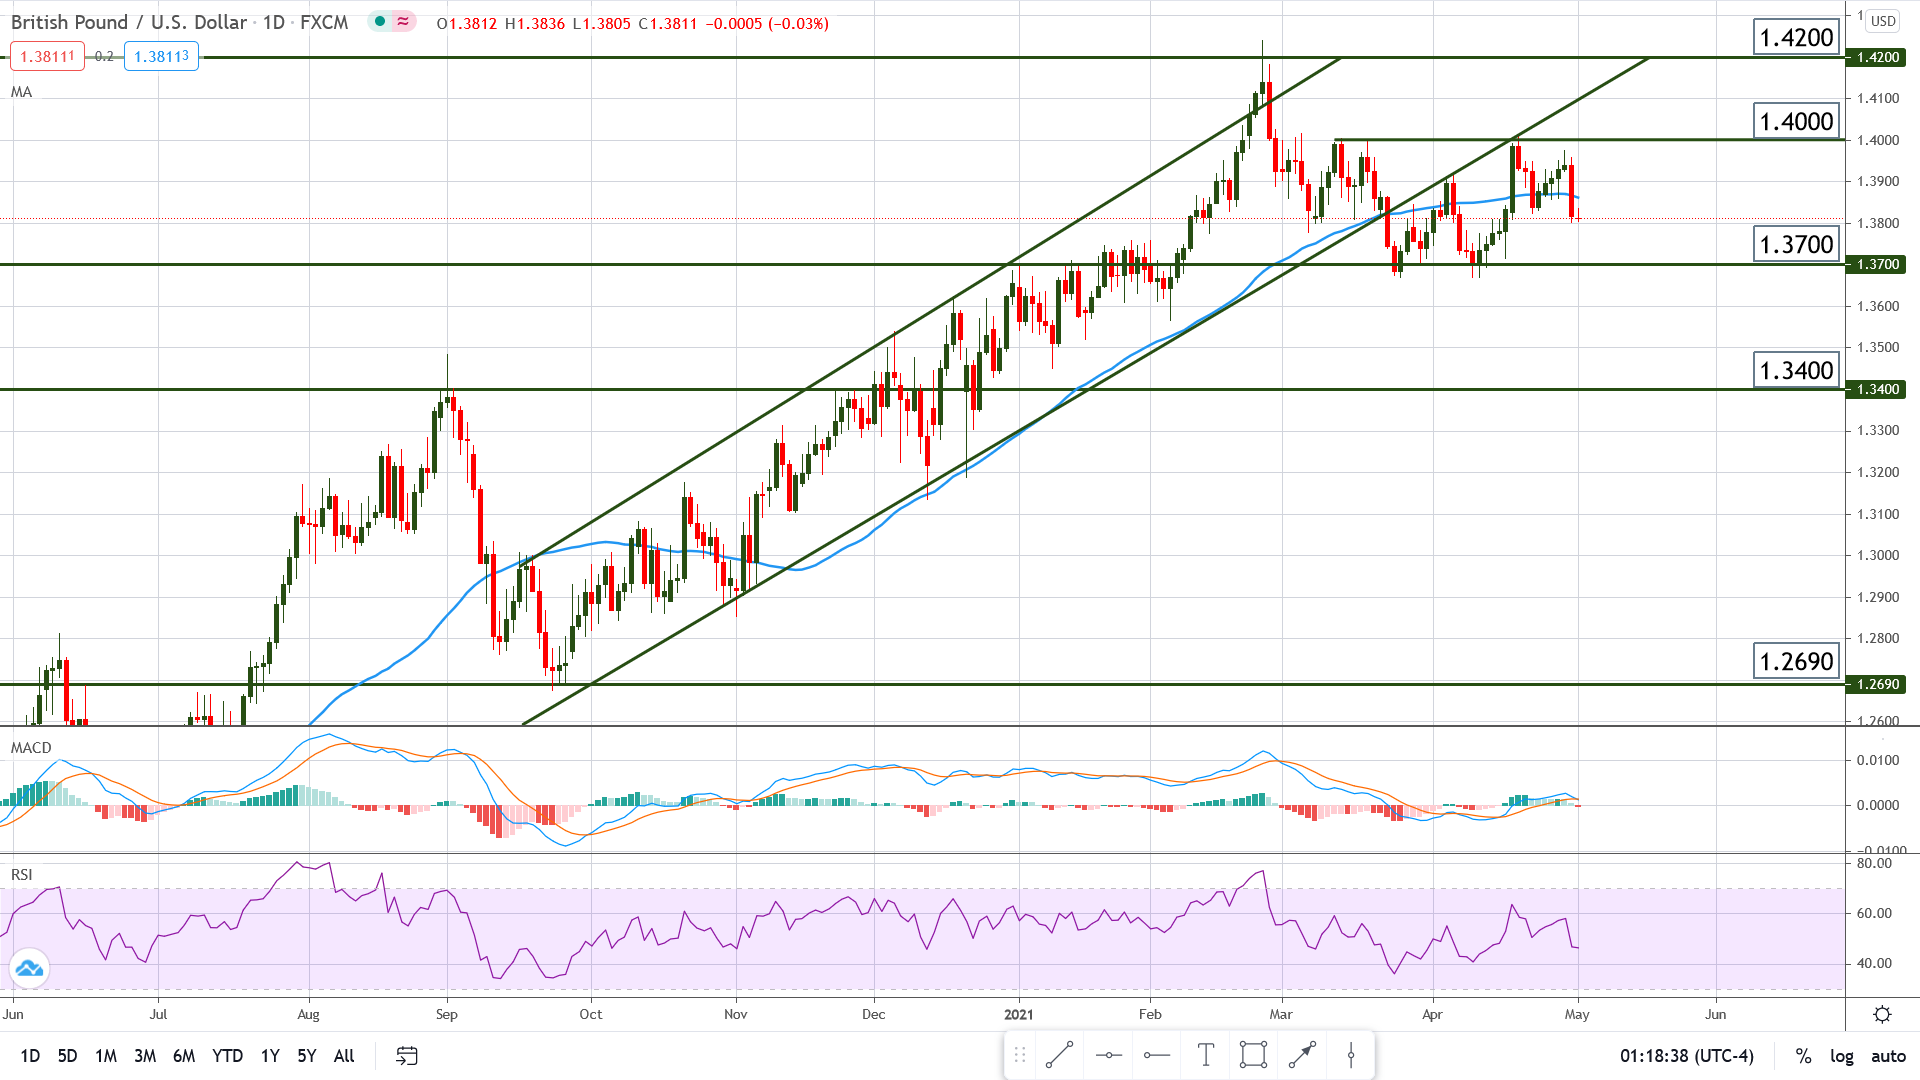
Chart Analysis – GBP/USD
The pair is currently trading at 1.3840 and the chart shows a bearish (red) Daily candle that engulfs the previous 5 bullish (green) Daily candles. This is regarded as a strong bearish sign and one that may very well generate additional movement to the downside.
Although the pair is now out of the rising channel that had confined it since September last year, price action still reacts to this chart pattern, as evidenced by the two touches from below. This means that the lower boundary of the channel will act as resistance in the future, while support is now located at 1.3700. The MACD and RSI don’t show a clear direction and the 50 periods Moving Average is almost flat, which may suggest that we will see a few days of ranging price action.