The FOMC Turns Dovish, This Is The Analysis You Need
Technical Overview And Weekly Price Predictions For Major USD Pairs
The Fed suggests monetary policy will be on hold all year, Eurozone PMI shows a dwindling economy, and Brexit drama continues with no real end in sight. This spells uncertainty and volatility in the Forex market, and means opportunities for savvy traders.
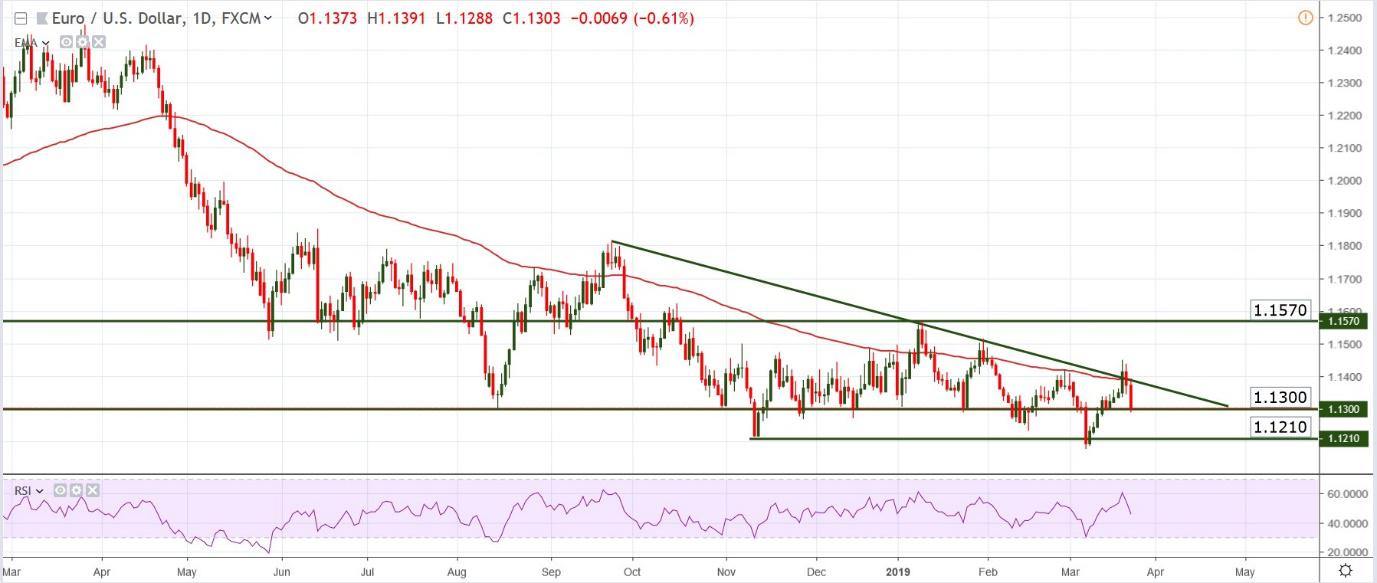
EUR/USD – Technical Outlook
After disappointing Eurozone PMI posted the Euro gave up ground against the US Dollar on Friday. The the pair tumbled into the support at 1.1300 which is still holding albeit bearish pressures are high. After confirming resistance at the down trend line the EUR/USD tumbled below the 100 days Exponential Moving Average. It is currently testing the support at 1.1300, if this level is broken the next probable target will become support at 1.1210 and then the YTD (year to date) low at 1.1180.
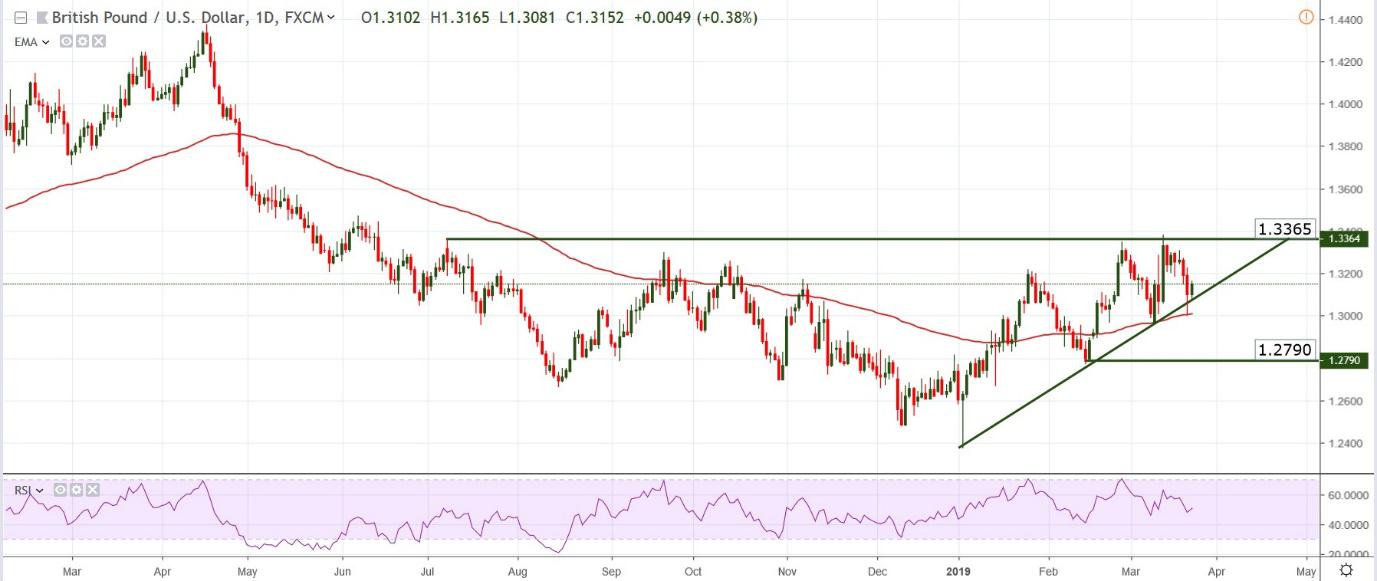
GBP/USD – Technical Outlook
The Pound dropped into 1.3000 area on the back of another failed Brexit vote but quickly recovered to 1.3150. The bounce confirms support at the moving average and returned price above a bullish trend line. In the recent period the pair failed twice to break resistance at 1.3365 but also bounced at the 100 days Exponential Moving Average. This paints a blurry picture with mixed signals and, considering the Brexit drama, the technical aspect will be overshadowed by uncertainty surrounding the fundamentals. A break of the 100 days EMA will open the door for 1.2790 – 1.2800 but another touch of 1.3365 is not out of the question either.
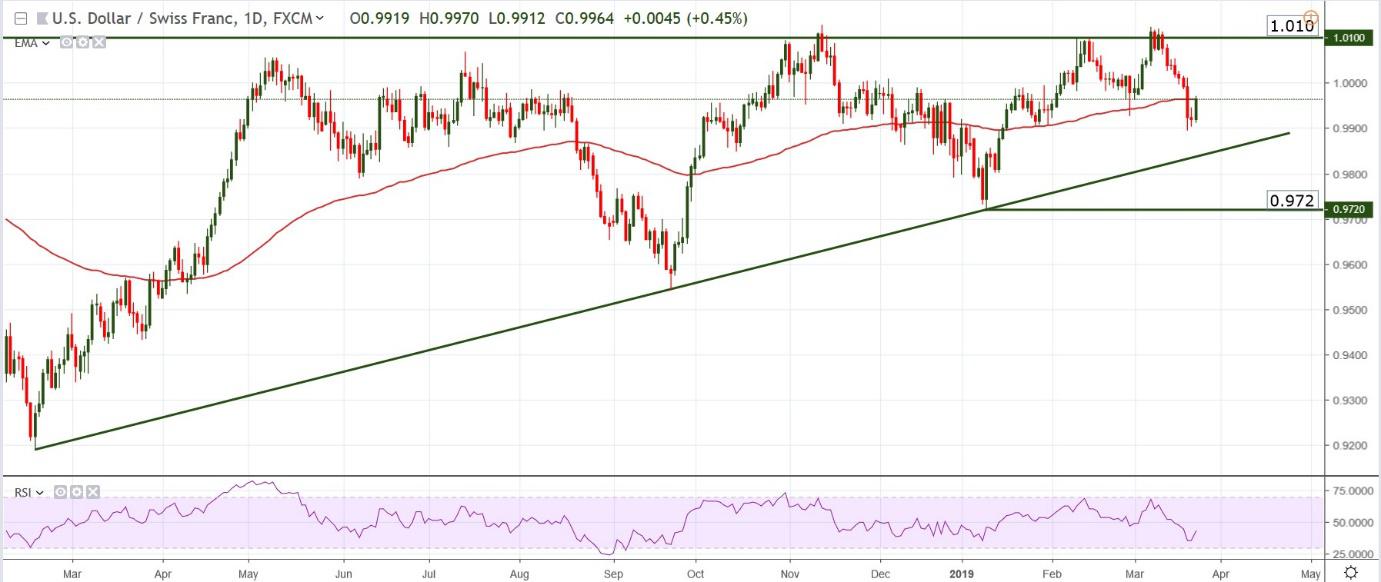
USD/CHF – Technical Outlook
The pair dropped significantly after yet another failed break of 1.010 and is currently trading at 0.9950. The last fall fro resistance also created a triple top which is a bearish chart pattern. Although the last day has been bullish for the US Dollar the move is nothing more than sellers are some profits off the table. If price stays below the 100 days EMA we will likely see a move into the long term bullish trend line and possibly into 0.9720. As an alternate scenario, the pair could enter a ranging period, trapped between 100 EMA and the resistance at 1.010.
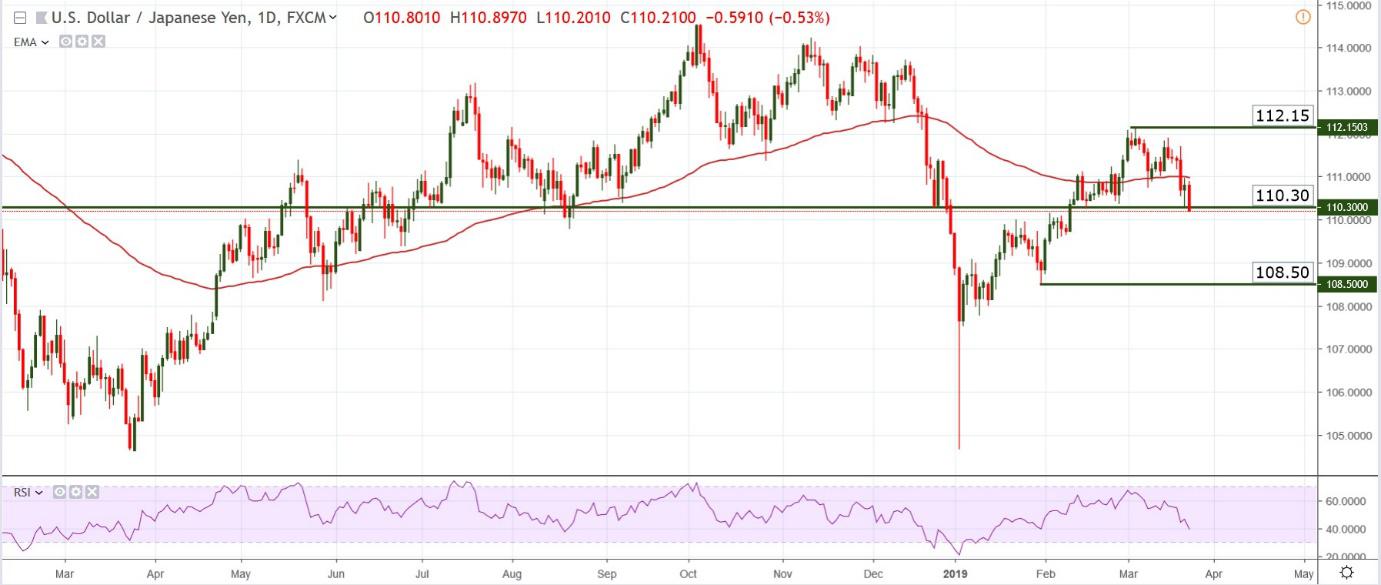
USD/JPY – Technical Outlook
Currently trading at 110.20, the pair is sliding lower after the rejection at 112.15 resistance. The current support is not particularly strong and may be broken without much fuss. The momentum belongs to the sellers and the chart doesn’t show a lot of buying interest. If the current support at 110.30 is broken, we can expect an extended drop, possibly into 108.50 or at least until the Relative Strength Index enters oversold. On the other hand, a bounce from the current level would take the pair into the 100 EMA but unless we get a strong break of the moving average, we cannot expect a significant climb. At best the pair may trend sideways between 110.00 and 112.00.