The End of the Rally? Or Just a Pause Before a New ATH?
Bitcoin Faces Downward Shift After Overbought Surge: Possible Dip Ahead
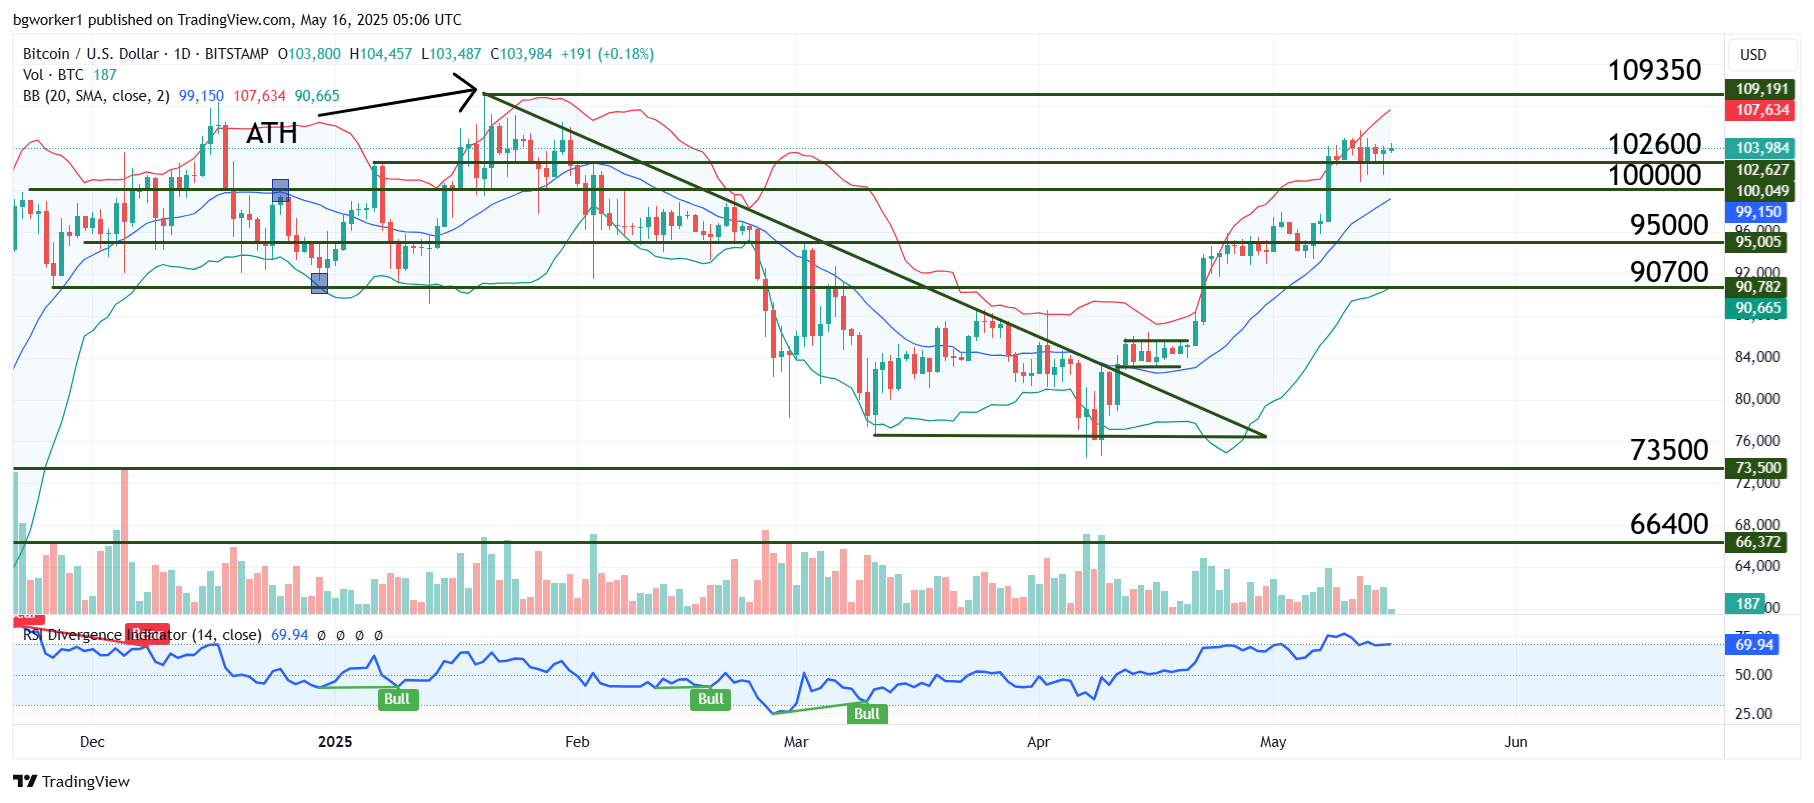
Ever since “Liberation Day”, the traditional and crypto markets have been operating under the intense influence of the new tariffs imposed by President Trump. While the initial response was chaos and bearishness across the board, as soon as the 90-day pause was instated, the market recovered and Bitcoin started a rally from the low at $74K. It is currently trading at $102K after reaching as high as $105K.
The crypto market was then further boosted by the announcement that tariff negotiations would begin with several countries. Soon after, it was announced that the U.S. and the UK had reached a trade deal and that U.S. and China representatives would meet to discuss a de-escalation of the situation.
On May 12, China dropped its new tariff on U.S. imports from 125% to 10% and the U.S. dropped the tariffs on Chinese imports from 145% to 30%. These new percentages are in place for 90 days, pending further talks between the two nations.
Buy the rumor, sell the news?
It is interesting to note that the actual announcement of the slashing of tariffs did less for the market than the initial announcement of the pause. This may be because the market already moved a lot to the upside when the tariff cut was announced but it may also be a case of the old saying “buy the rumor, sell the news” at play.
Oftentimes, the speculation about certain events deemed positive by market participants does more for an asset than the actual happening of the event. For example, when the market catches a rumor that the Fed will start cutting or increasing the rates, it will move stronger than when the Fed actually changes the rate. This is because the event (rate cut or increase) is already priced in the market by the time it takes place.
On the other hand, maybe Bitcoin and altcoins are just in a period of accumulation, preparing for the next move. If another wave of bulls enters the market, we will likely see BTC’s price challenge the All-Time High (ATH) located just above $109K.
Chart Analysis – BTC/USD
After breaking the resistance at $102,600, Bitcoin failed to move significantly higher and created a temporary top at $105,700. This pause is probably caused by the overextension of the move that started in the $74K area.
Currently, it looks like the bulls are accumulating again but we should not exclude a deeper pullback, considering that the pair did not make a proper correction since the start of the rally. If such a pullback happens, it may find support at $100K. By the time the price gets there, the middle line of the Bollinger Bands will climb into that same area, creating a confluence zone that will provide stronger support. The first resistance is located at the previous top: $105,700.