The Bitcoin Market Is Turning Bullish
The Bitcoin Market Is Turning Bullish, But How Long Can It Last?
The Bitcoin market has been drifting lower desperately in search of support for some time. The world’s leading cryptocurrency made a stunning recovery earlier this year and then gave up half the gains with equal quickness. Bitcoin has hit, and smashed through, several support targets on its way down and now it is sitting on another one. The coin bounced off of the $7000 level last week and now looks like it is ready to move higher. The question is, how high will it go? Is this just another mid-trend relief rally or could it be, might it be, the beginning of the next big move up for Bitcoin?
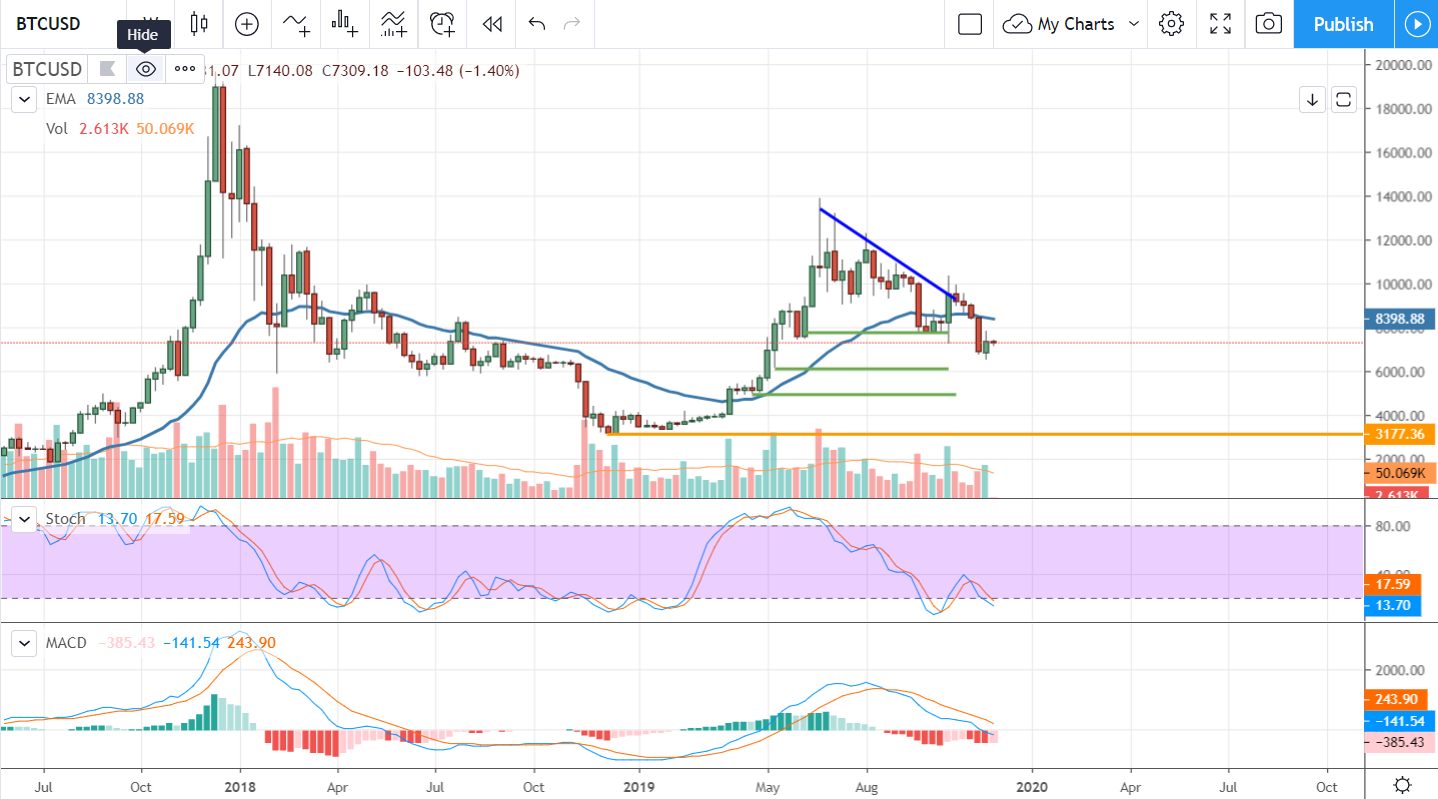
Let’s look at the weekly chart first. The weekly chart shows an asset bouncing above a support target with indicators that are hardly bullish. If, and I say if, Bitcoin prices were to move higher from here the indicators are set up to show support. If the indicators were to produce a bullish crossover at this level or during the bounce it would be a technically “strong” signal. Bu I said if. As things stand now, the Bitcoin weekly chart is still set up for the coin to move lower. Don’t be surprised if it does.
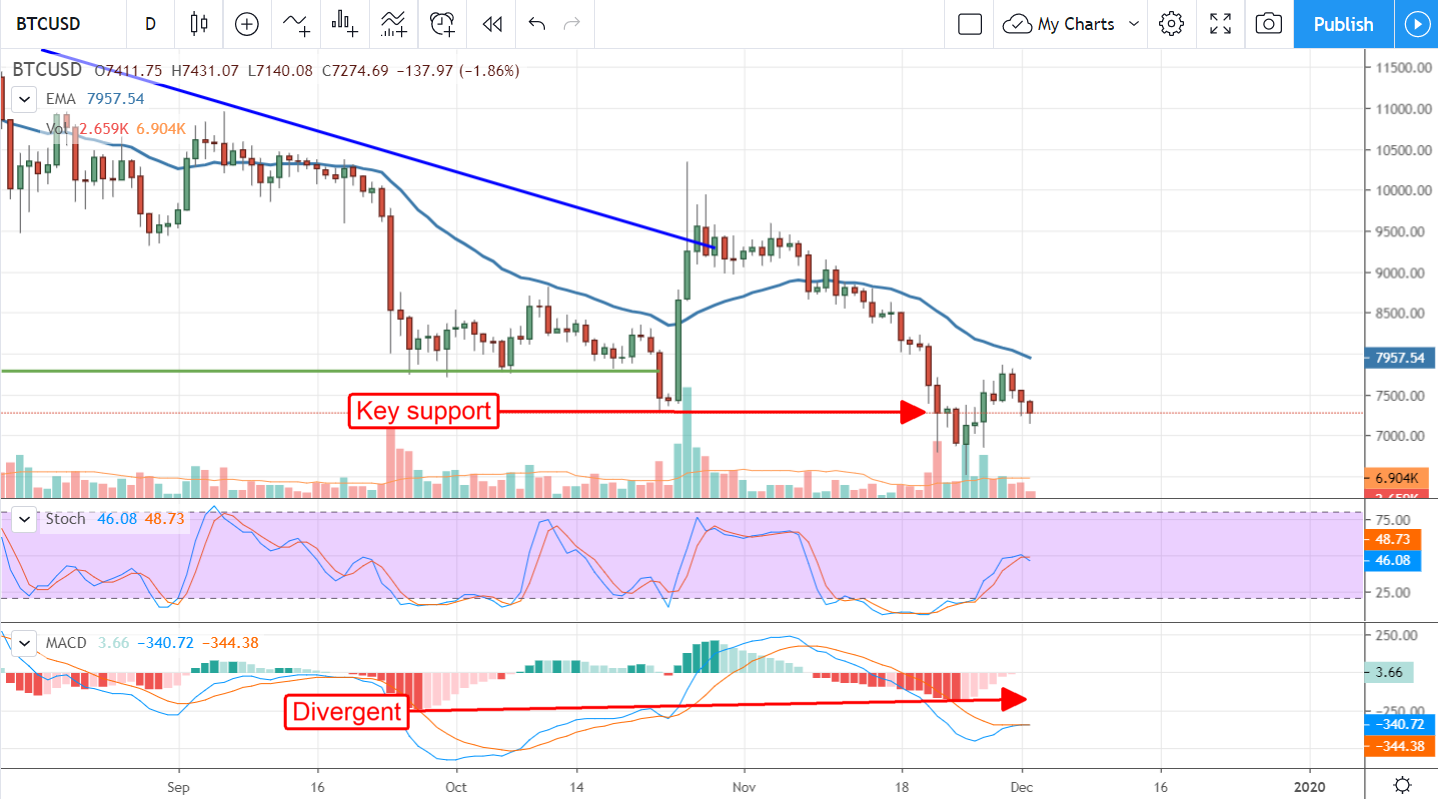
Now, let’s move on the daily chart. The daily chart clearly shows a coin that is bouncing. What it also shows is a battle between the bulls and bears at the $7500 level. Prices bounced strongly from $7,500, moved up to the down trend line, fell hard to retest $7500, and now the battle of buyers and sellers is holding steady at/near $7,500. The trend is in favor of the bears, the indicators in favor of the bulls. Divergences in both stochastic and MACD suggest the bears have overextended themselves, a fresh bullish-crossover in MACD that the bulls are taking control of the market.
The Final Analysis
The final analysis is promising. Bitcoin is indeed at a key level of support. If the bulls are able to get prices back over the 30-day EMA we’re likely to see a nice rally, at least for the near term. If not, if not then the downtrend is still intact and a fall below $7,500 is highly likely. If the $7,500 level breaks a move to $6,000 is possible.