The After Hours Trading Strategy For Binary Options
A web site I just reviewed made a statement that is sticking with me; “you got to have a good strategy”. That is only too true, a good strategy is a corner stone of a great binary options trading system. Systems include fundamental as well as technical analysis and money management in addition to a strategy but today I am focusing on the strategy portion. There are lots of great strategies to be found on the internet ranging from simple use of individual indicators to techniques involving complex indicators like Ichi Moku, Bollinger Bands ™ or Elliot Waves. For the purposes of this article my examples will be based on my chosen indicators; stochastic, MACD, support/resistance and moving averages. The good news is that this technique, the after hours trading strategy, can be applied to ANY good strategy and will probably improve your results.
The problem with most strategies, and for most traders in general, is that applying strategy is hard. Even the easiest strategy to master is a difficult one to master. First there are the rules. Each strategy has rules that must be followed, the tricky thing is that the market is always changing and rules have to be adapted. Another problem many traders face is knowing which signals to take. Some strategies are trend following, some are contrarian, some work better in range bound markets and some require decisive break outs. Compounding this problem are the indicators themselves. Many indicators, such as oscillators and moving averages, can produce both bullish and bearish signals regardless of market conditions. In addition there are false signals and whip saws to consider. I know that every one of my indicators, and every indicator I can think, can provide false signals.
Trying to make sense of all the possibilities is hard enough by itself before you add in time frames. What time frame are you looking at? How long are the candles? How long does it take a signal to develop? What expiry should I use for best results and more questions affect our trading decision every day. Now, try to synthesize all of these questions and answers into a coherent answer while the market is open. At any minute news could be released, economic data could be announced, a war could break out or oil supplies could be disrupted; all factors that could change your analysis in an instant. It is no wonder that so many new and experienced traders alike get their heads spun and end up washed out of the markets.
How is a trader to overcome all the noise and have the time to make sound analytical trade decisions? By using the after hours trading strategy. This is accomplished by focusing all your analysis time to after the close of the New York sessions and before the opening of the Asian/European sessions. This window provides a few hours of relative calm for market participants. There is typically no major business or economic news in that time and nearly all markets are closed. Traders can use that quiet time of the day for more efficient and effective analysis without the noise of an open and busy market. It also means that you don’t have to sit in front of the computer all day waiting for signals.
The really good news is that this method can be used in nearly any time frame of trading except the high frequency 60 second and 2 minute high speed turbo style of binary. I know some of you prefer to trade that way but statistically speaking less frequent longer term traders have a higher rate of success. You can use this method to get ready for a day of 60 second trading by determining your market stance and the underlying trend then only trading in that direction.
How To Use The After Hours Strategy
This is how it works, you can do this every day or any day that you want to make a trade. First, wait for the markets to close and give enough time for any after hours earnings reports to be released. Usually by 5PM the day is done and you can begin. I start by checking the earnings and economic calendars for the next day to see if any market moving events are on tap. Next I look at a chart of weekly prices, usually candlesticks, to get an idea of the underlying trend. I look to see what the long term trend is and where price action is relative to that trend. Basically, is price action moving in line with the trend or is it consolidating/correcting. This is usually a cursory look only as the long term conditions change so slowly.
Next I move down to the charts of one day prices using my trend lines, a 30 day EMA, stochastic and MACD. I may take a signal off any one indicator but a convergence of indicators is always a much better signal. If is see a signal I plan on a trade and enter it into my account as soon as the market is open. On the daily charts I stick to one week/end of week expiry for strong signals and one month expiry for weaker ones to give them time to move into the money. The thing is, if I don’t see a trade in the first 5 or 10 minutes of analysis I don’t trade. It’s that simple. The daily charts give signals on a weekly or bi-weekly basis which is not many I know. This technique also works very well with hourly and 30 minute charts providing numerous signals. The trick is to trust your analysis, enter each trade the next day and then sit back and forget about it because you are also using sound money management.
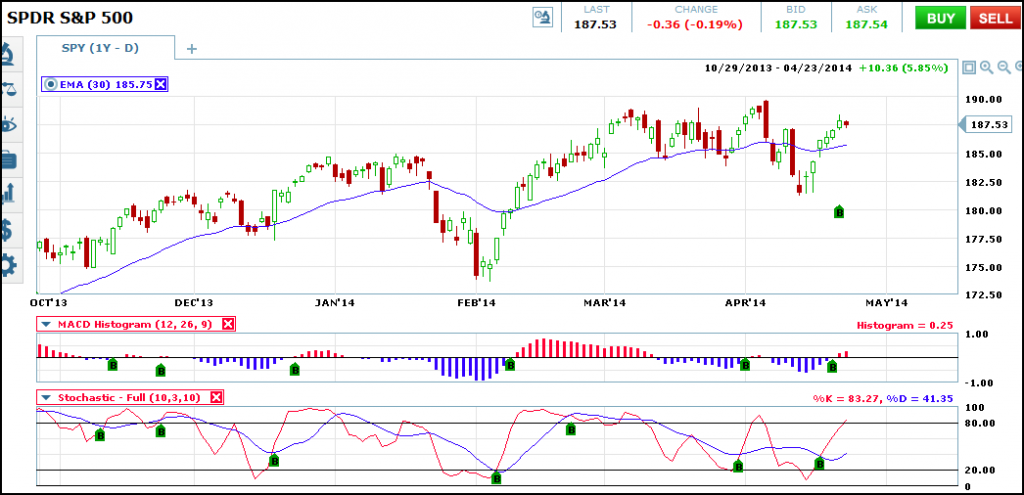
This one year chart of daily S&P 500 prices offers 12 stochastic and MACD signals. 12 signals in one year is not a lot I know but you need to consider the fact that every single one of them resulted in a win using a 3 day to one week expiry. What would you rather do, trade a lot with dubious results or trade a little and be 90-100% right in your analysis? I don’t know about you but I prefer being right to being a day trader.