Tennessee Shows Bitcoin Some Love
Price Action Remains Unaffected
by Bogdan Giulvezan
Despite the recent lethargy that’s present on Bitcoin charts, the flagship cryptocurrency is making its way deeper and deeper into the mainstream and is viewed more often as a viable form of payment. The latest win for Bitcoin comes from Jackson, Tennessee: Friday, Mayor Scott Conger announced that the city plans to allow citizens to pay their taxes in Bitcoin.
Quoting the Mayor’s tweet: “Our blockchain task force is looking into how the @CityofJacksonTN can accept property tax payments in #bitcoin and allow our employees to DCA in Bitcoin.” In another tweet, Mayor Conger complained about inflation and how it makes every dollar worthless: “Why do we accept inflation? Why don’t we demand more from our federal government? 6.3% in 2 years. 172.8% in my lifetime. Every year our dollar is worthless.”
Scott Conger’s plan for crypto integration was first revealed in April, following the example of Miami’s Mayor, Francis Suarez who also pushed for tax collection using Bitcoin and for municipal workers to be paid in BTC. Mayor Suarez also expressed his willingness to turn Miami into a hub for crypto mining by welcoming miners that are relocating from China.
Keeping up with the bullish news trend, PayPal recently increased the weekly buy limit for cryptocurrencies to $100,000 and the company is also expected to allow crypto withdrawals soon. However, an exact timeframe is not known at the moment but this is yet another nod to cryptocurrencies and shows that mainstream adoption is possibly just around the corner.
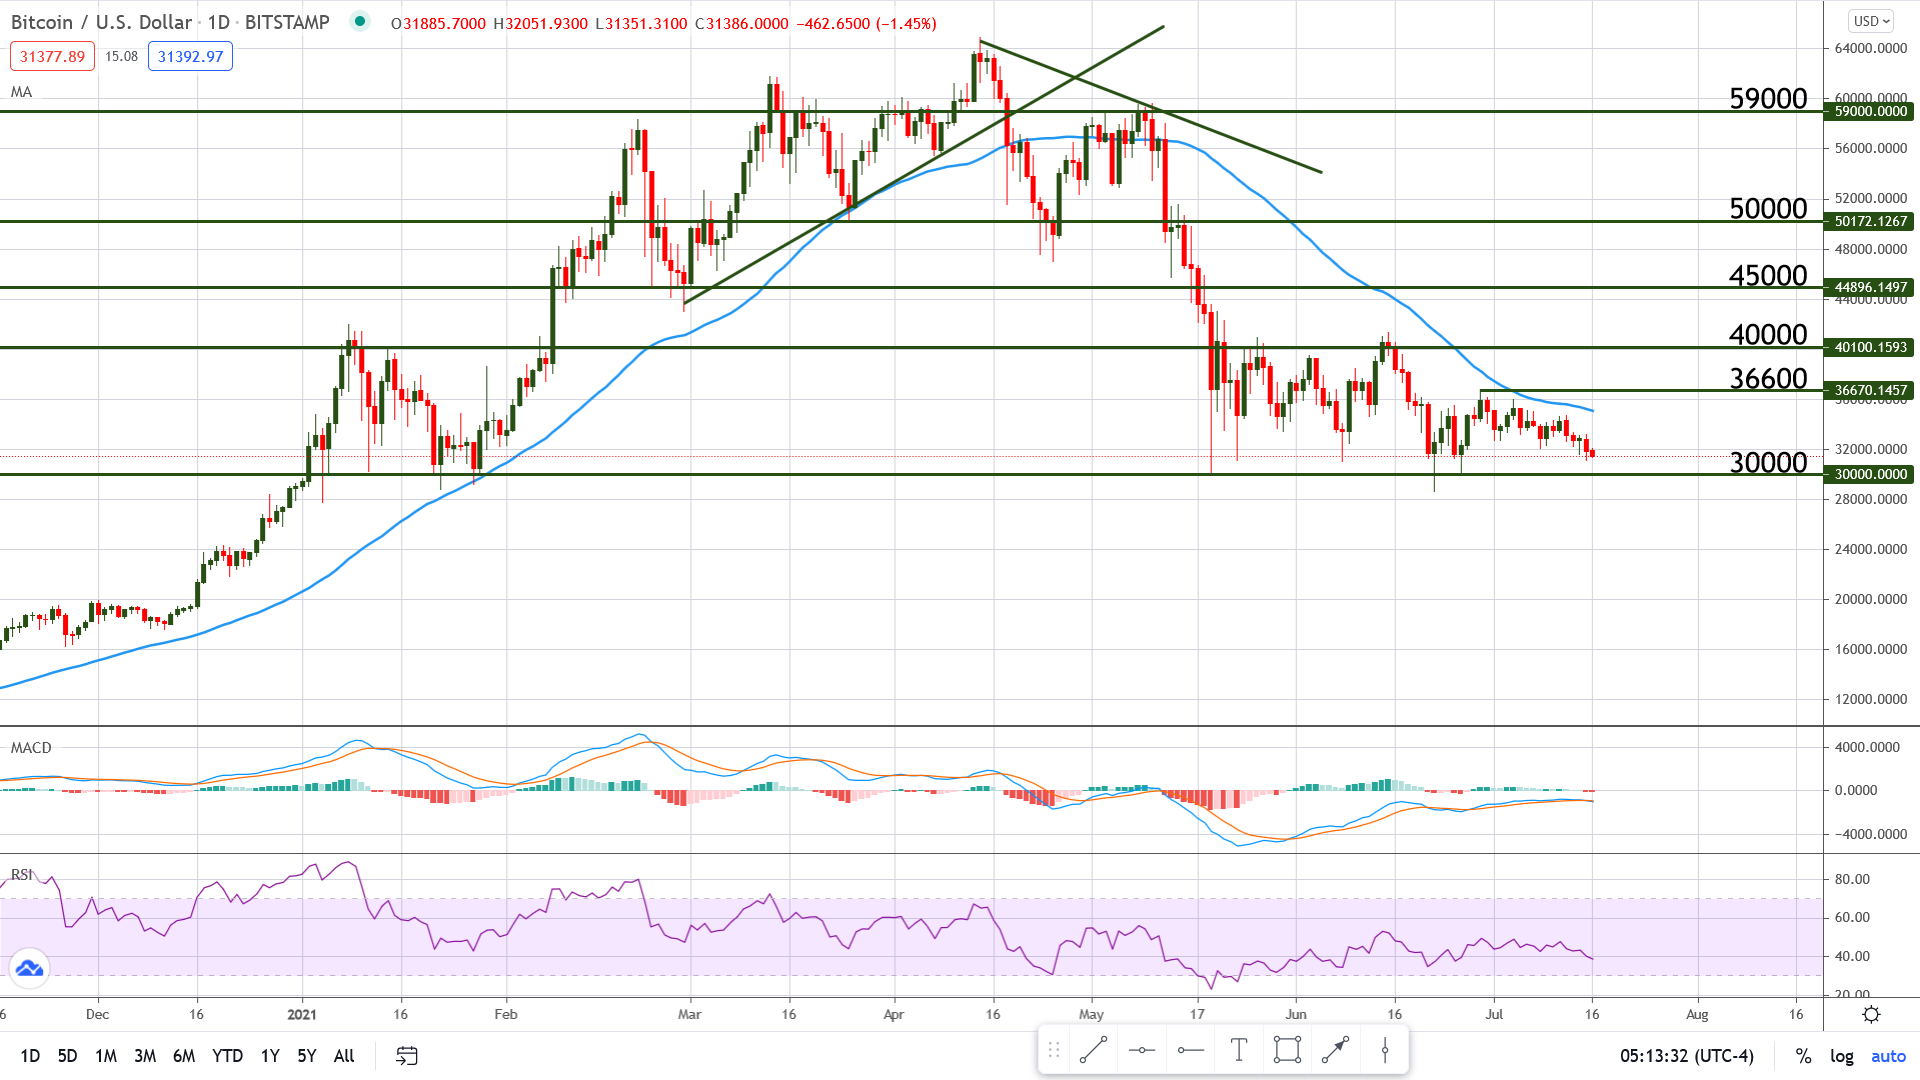
Technical Outlook – BTC/USD
Bitcoin continues its sideways stroll and seems like nothing can wake it up from the slumber it is in. The pair has been trading in a range since mid-March, which is one of the longest periods of low volatility in recent history.
Currently trading at $31,400, Bitcoin lost 4.42% over the last 7 days and it is under bearish pressure, capped by the 50 days Moving Average and by strong resistance at $40,000. From a shorter-term perspective, the chart shows resistance at $35,000 followed by $36,600.
The MACD is moving sideways and its lines are close together, indicating a lack of momentum, while the Relative Strength Index is sliding lower without showing an extreme condition. It looks like the next destination is the key support at $30,000, which proved to be a good barrier for falling prices until now. A break of this support could spell disaster for BTC bulls, as it would open the door for much lower prices.