Support Levels Continue to Fail, Bitcoin Enters Ranging Territory
The Crypto Market Is Still Under Pressure, Yet Bitcoin Weekly Chart Hints at Bullish Rally
by Bogdan Giulvezan
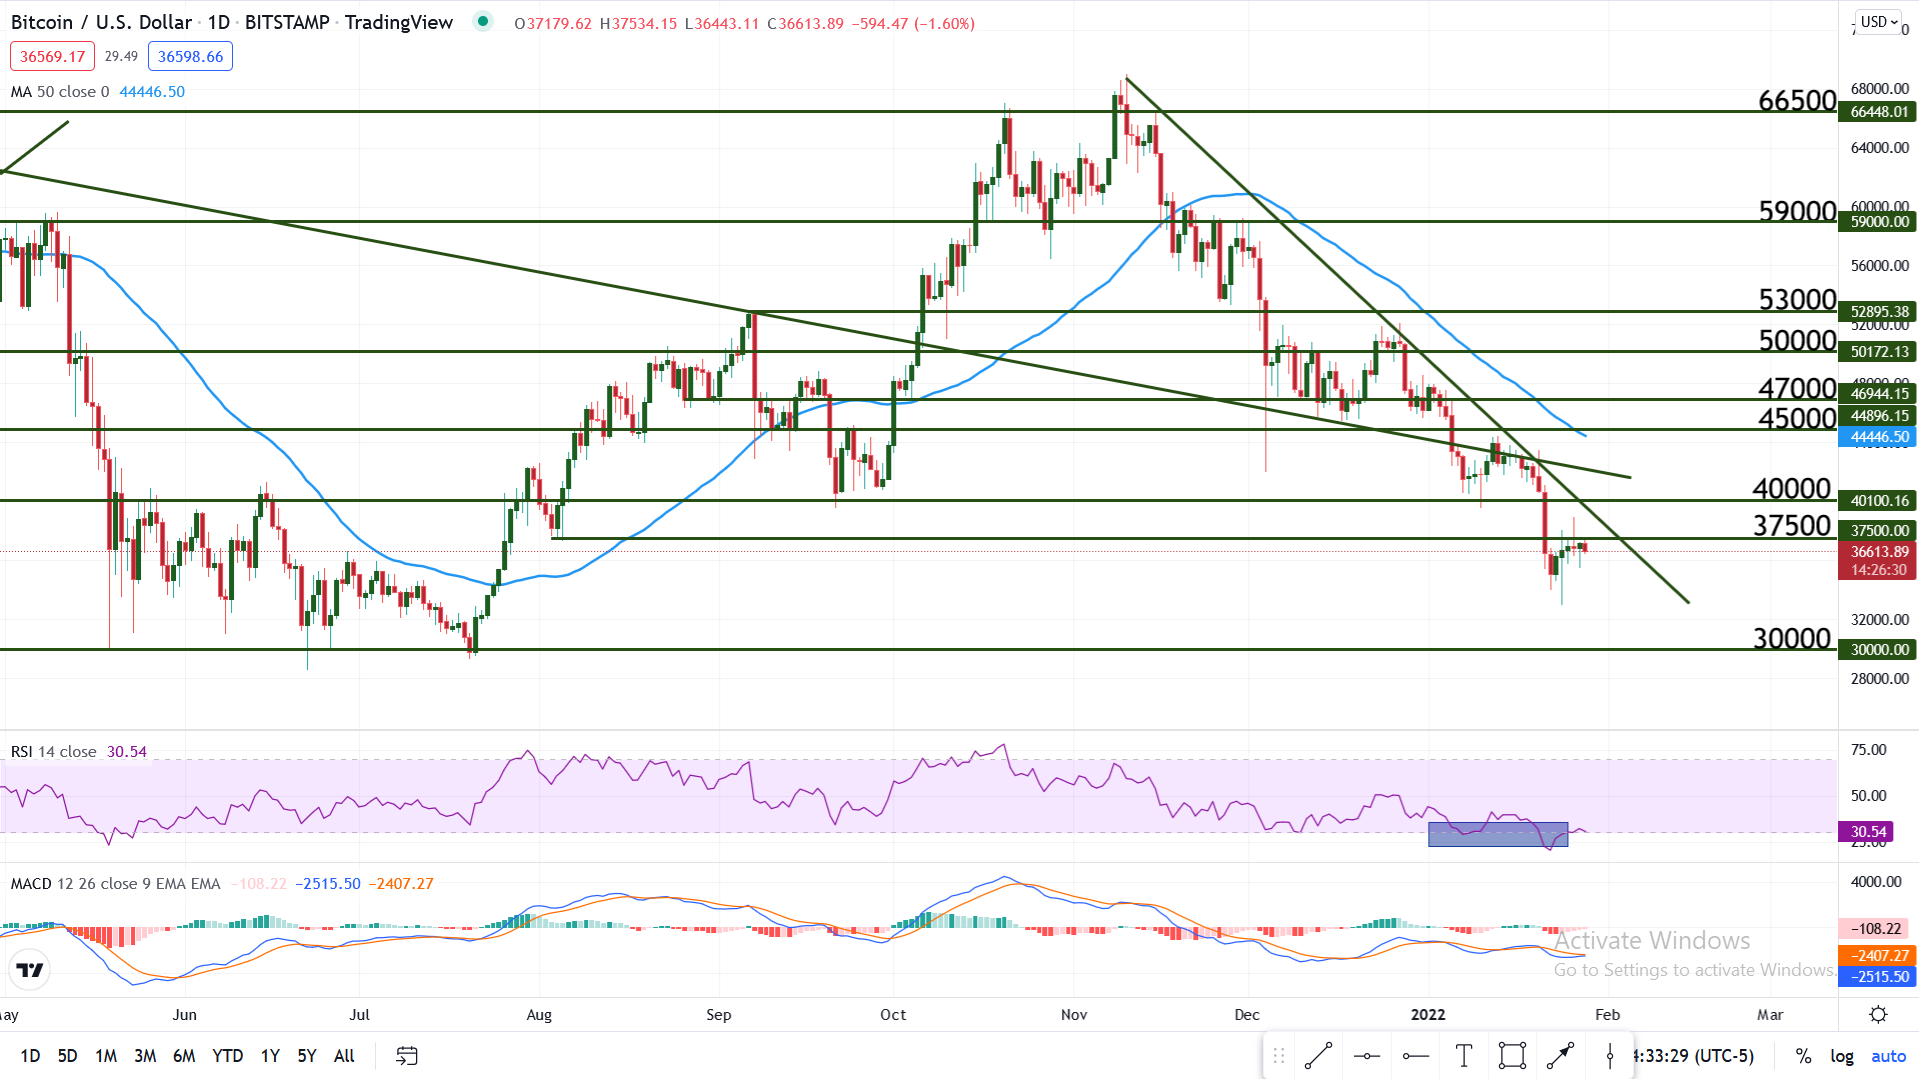
Since early November 2021, the apex cryptocurrency has been sliding lower and lower, failing to rally as major support levels were broken. Bitcoin is currently trading at $36,500 and has entered the dreaded May – July 2021 range territory.
The $40,000 level offered support in September 2021 and more recently, in early-January 2022, but on its most-recent encounter, Bitcoin moved through it like a hot knife through butter, reaching a low of $32,950.
Taking a look at the daily charts, we can see that Bitcoin recovered a little, but price is now hovering inside the long-term range where it spent several months last year: $30K to $40K. This begs the question: should we prepare for another period of sideways movement or will we get some directional price action. Of course, it’s difficult to say for sure unless you have a crystal ball, but here are some of the signs that point towards directional movement as opposed to a range-bound scenario.
We usually talk about Bitcoin and sometimes forget that its price is directly affected by the price of the other currency in the pair: the US Dollar. Lately, the greenback has made serious advances against its major counterparts, even reaching a 7-month high against the Euro, in part due to rate hike expectations. A strong US Dollar makes it harder for Bitcoin to rally and to gain some ground, thus the recent dip in BTC/USD can be attributed in part to USD strength, and not completely to BTC weakness. As soon as the dollar momentum starts to fade, we may see bullish action on BTC/USD.
Another important hint towards directional movement is that on a Weekly chart, BTC/USD shows hidden bullish divergence. This occurs in an uptrend (BTC is of course in an uptrend on the Weekly chart) when the price makes a higher low and the indicator (in this case the RSI) is making a lower low. It is a strong bullish signal but it’s not 100% accurate, and it can take a while until price actually starts to move up.
Chart Analysis – BTC/USD
With Bitcoin trading just under $37,500 resistance, the first indication that a reversal is underway would be a move about said level. If the bulls fail to break this resistance, the other possible scenario is a continuation of the bearish pattern but keep in mind that the pair is oversold for quite a while (as shown by the RSI and other technical indicators), which means that the extent of another potential drop will be limited.
The recent Daily candles tell a story of indecision (long wicks and small bodies), while the Weekly candle will most likely close as a Doji. This type of candle is another sign of indecision but it can also appear at the end of a directional move. In other words, it could signify the end of the recent bearish pattern.
The main levels to watch are $37,500 and the bearish trend line that is in close vicinity. Once and if these hurdles are surpassed, the momentum may change in favour of the bulls.