Simply Trend Confirmation Tool – Support and Resistance Indicator
As primarily a trend trader, my goal is to trade in the direction of the trend, by entering on pullbacks and then taking my profit on the next trending wave.
The basic envelope strategy discussed extensively in my day trade articles attempts to capture such moves. The problem is that unless you are very good at picking out trend shifts, and seeing higher-highs, lower-highs, lower-lows, etc develop in real-time, the strategy can be hard to implement. This is likely the case with a lot of trend following strategies. In theory it seems easy, but when traders go to actually implement a trend trade, they may find trends alter course more often, or the trend isn’t as smooth, as they anticipated.
Applying a simply support and resistance indicator on your chart can help in this regard.
S&R Indicator
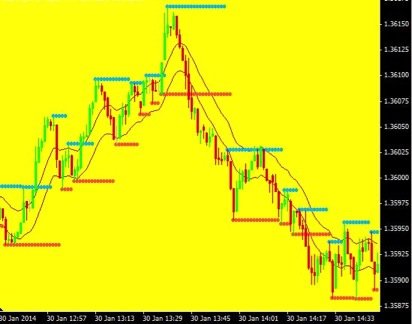
The chart below is from MetaTrader 4 (a free downloadable trading and charting platform), although the lines can also be drawn manually.
The basic idea behind the indicator is that it marks short-term high points and low points with horizontal lines. Instead of getting caught up in watching every tick on the price chart, traders can simply look at the indicator.
Figure 1. Support and Resistance Indicator
Trading Trends
In an uptrend, like on the left of side of figure 1, resistance lines (blue) and support lines (red) should be stepping higher. This is because an uptrend is created by higher-highs and higher-lows.
In a downtrend, as seen the on the right hand side of figure 1, notice how both resistance and support levels are moving lower as the price makes lower-highs and lower lows.
Using an indicator such as this, or manually plotting the lines yourself, can be used as a trend trade confirmation tool.
Only take long positions (buy calls) when both the support and resistance are stepping higher.
Only take short positions (buy puts) when both the support and resistance are stepping lower.
As an added benefit, if the price is moving within range, a barrage of support and resistance lines in a similar area will likely alert you that no trend is currently present.
If you already have MT4, you can download a simple version of the indicator here: MT4 Support and Resistance Indicator
Warnings
Like any indicator, or even if you do it manually, there are a couple pitfalls. Depending on how you trade, and on what time frame, you may find that marking every high and low makes the chart far too cluttered. Marking only “relevant” highs and lows may make the chart less cluttered but possibly some important information will be missed, such as subtle shifts in momentum near the end of the trend.
Some price analysis is still required to provide an overall perspective on the price action. For example, a slightly lower low and lower high may develop during a pullback after a very strong run higher. Being able to see that it is a pullback instead of a reversal still requires some analytical skill (See Should I Hold Through a Pullback? Part 1 and Part2).
Overall though, while it is isn’t perfect, an indicator such as this–or just drawing similar lines yourself–may help you see trend and reversals better.