“Simple as ABC” Trading Strategy
The following ABC trading strategy isolates turning points, as well as gets you into trending trades. The trade setup is quite simple, yet highly effective, and with a little practice you’ll see the pattern often. It can be used on any time frame, and takes advantage of the natural tendency of markets to move in one direction for several price swings before reversing and swinging in the other direction.
A-B-C
Figure 1 shows a basic ABC pattern for taking a long position. There is a low, marked A, then the price moves higher, marked B, then price pulls back and is marked C. The pullback at C can never reach point A, otherwise progress isn’t being made and it is not an ABC pattern.
The aim of this pattern is to show that the price has moved higher, pulled back less than prior move higher, and will now likely continue higher.
Figure 1. EURUSD 15 Minute Chart – ABC Buy Pattern
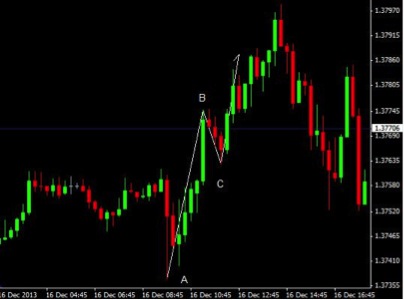
Figure 2 shows the ABC sell pattern. It is just flipped upside down. There is a high point, marked A, then a move lower, marked B, and then a pullback (up) marked C. C cannot move all the way back to A.
The sell pattern occurred right after the buy pattern, so it could have been used to capture profit on the way up and the way down.
Figure 2. EURUSD 15 Minute Chart – ABC Sell Pattern
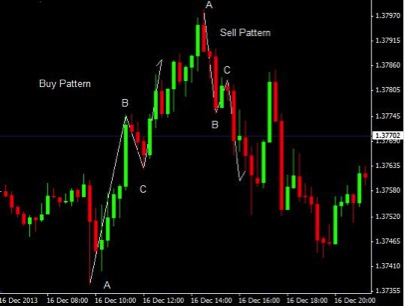
Figure 2 shows relatively large ABC buy and sell patterns. If you look closely you will also see some smaller ABC patterns on the chart.
ABC Entries
An entry occurs as soon as we can reasonably assume C is in place and the price is now moving in the anticipated direction. At the very latest we can enter near point B.
Figure 3 is the same ABC buy pattern shown in the previous chart(s), but here it is shown on a 5 minute time frame. The area for trade entry is marked with a white box.
Figure 3. EURUSD 5 Minute Chart – ABC Long Entry
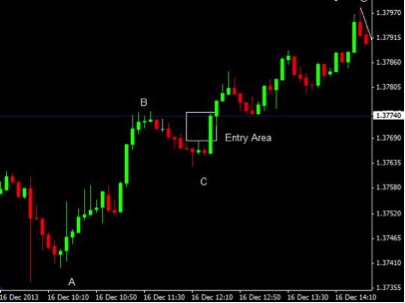
The closer the entry to C, the more chance of entering prematurely while the price is still dropping. Yet, the potential reward is greater and risk smaller. Entering closer to B makes it much more likely the price is moving favorably in your direction, but the risk is slightly larger and profit potentially smaller (some of the move has already been missed).
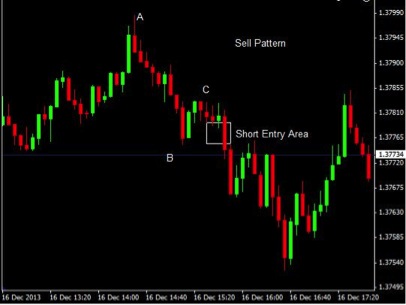
Figure 4 shows the entry area for a sell pattern.
Figure 4. EURUSD 5 Minute Chart – ABC Short Entry
Reading Trading the Mini-Channel Breakout may help isolate entry points when the pullback takes the form a small channel.
ABC Stops and Targets
If you are trading binary options you won’t need to concern yourself too much with stops and targets since your risk and potential profit are known at the outset of the trade. For those trading other markets, you’ll need to control risk and have a profit target to lock in profit.
For a buy pattern the stop is placed just below point C. For a sell pattern the stop is placed just above C.
Targets are based on a couple different methods. My preferred method is simply make my profit target 1.6X my stop. So if the stop is 10 pips, I am looking to make 16 pips. If the price is moving aggressively toward the target is will move it a bit further in order to catch a few more pips. But usually I just take the profit and then look for another setup.
Many traders also like to use a Fibonacci Extension tool for exits. It can be applied to any price swing and help indicate where the market is going. See Use the Fibonacci Extension Tool to Find Targets and Likely Reversal Points.
If an ABC patterns occurs in the opposite direction of your trade, take your profit immediately and don’t wait for the price to reach your target, since it likely won’t. If you are feeling particularly aggressive, when this scenario occurs you can exit your former trade and take a new trade in the direction of the new ABC pattern.
Final Word
The ABC is a simple pattern that can be used to spot reversals and trade with trends. It can be used to capture both upside and downside moves on all time frames. When a buy pattern occurs it signals a strong likelihood that there is another move higher coming, whereas a ABC sell pattern indicates another move lower is coming. No strategy works all the time, but it can help you stay on the right side of the market, and also spot when it is turning against you.