Sept 9 US morning session NQ, play-by-play CST
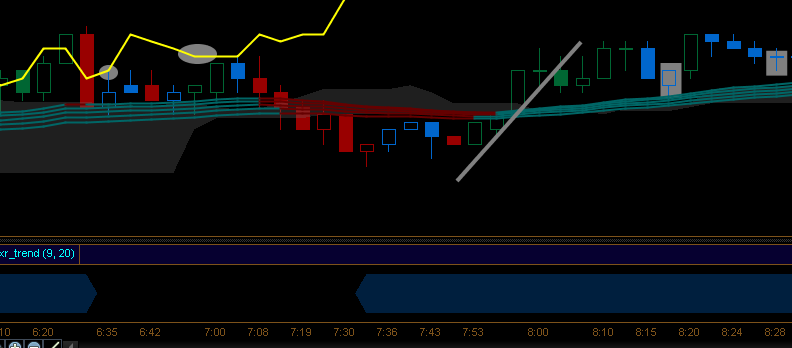
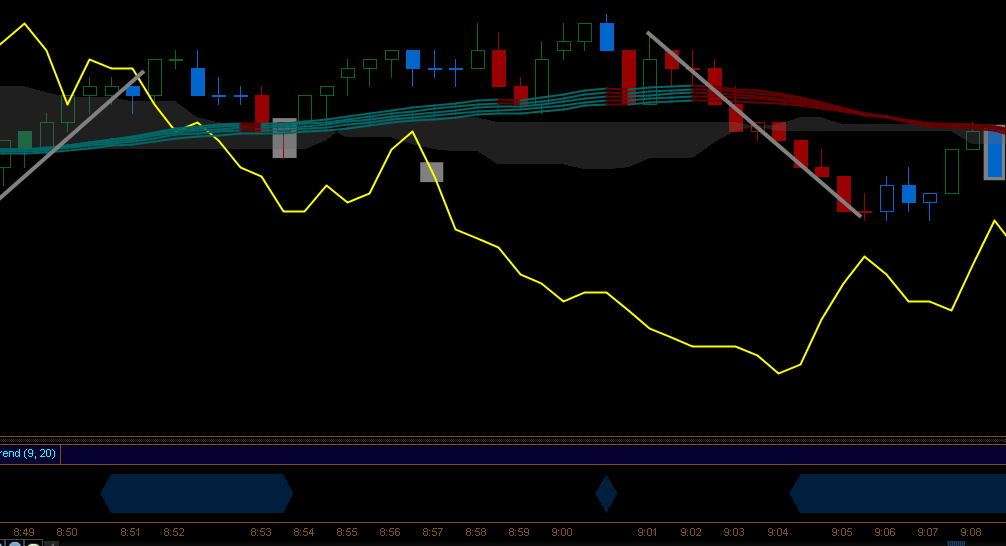
LHS incentive move downward but no follow through & the chikou does not clear the Kumo. Followed by incentive move through EMAs and Kumo with clear chikou that does hold, resulting in entries.
The first two entries are good for 30 to 35 ticks. That’s a pretty big move and the chikou is running into price as current price is running into equilibrium (the EMAs). The highlighted candle is an okay entry given that there is already money made. Notice that even though the chikou is technically below price, that particular price level does not really mean anything. If the upward move had reversed off a parabolic candle it would have significance, but here it does not mean much so I’m not concerned with the chikou, other than we may be consolidating but there is probably still some move left given the EMAs & Kumo. In general I often don’t use the chikou but that’s because I have traded this indicator enough that I am aware of it’s location & meaning without printing it. It’s a very important part of the ichiMoku system. In particular it is a big part of why you don’t need to look at multiple time frames in order to trade it. Just as an example, if you play around with it you will be able to predict what a double compression Kumo looks like based on the current Kumo & the chikou. However that is not necessary, even though I only display roughly 30 candles on my chart the ichikou is giving me a meaningful, trade-able summary of the last 108 candles. That allows me to focus on now, in context.
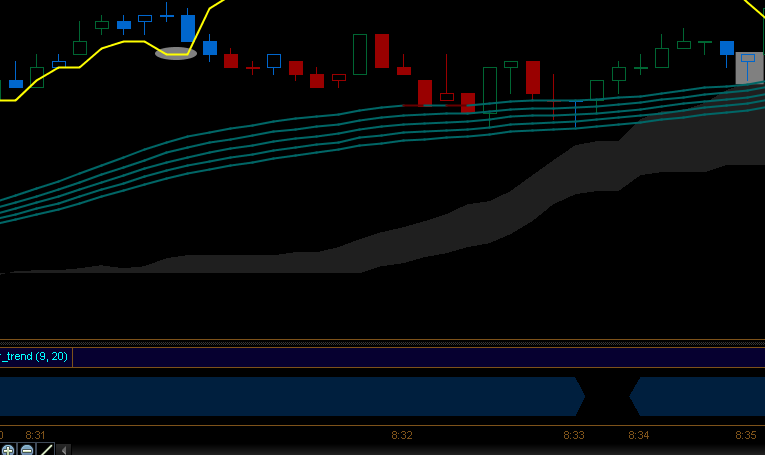
Again the chikou is at price & price is into equilibrium. This time though looks weaker than the last. The EMAs briefly turned red & there is what looks like a lower high in place. The Doji in the EMAs is okay, but I would prefer to get through a consolidation at this point.
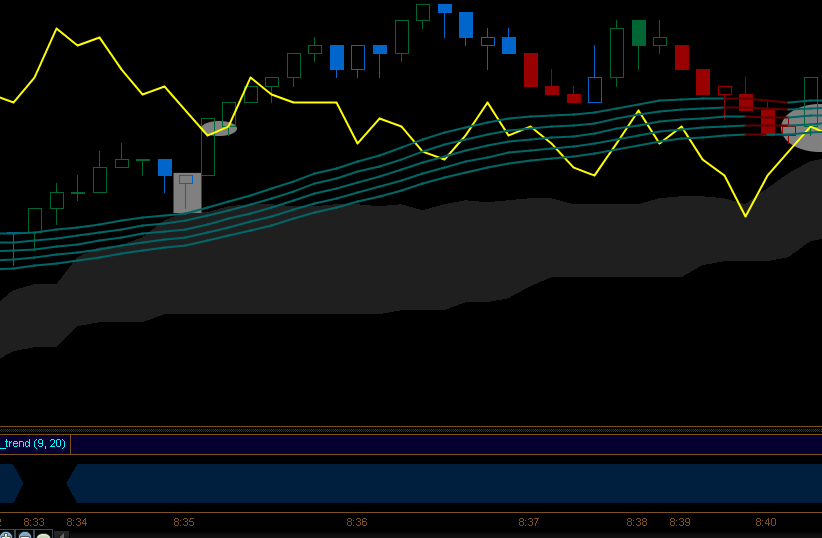
Consolidation follows, then an incentive move through the averages & just through the Kumo. The red hammer at the pullback to EMAs & Kumo is a decent spot. It’s red but its location & shape are compelling enough.
Nice incentive move & pullback, clear entry.
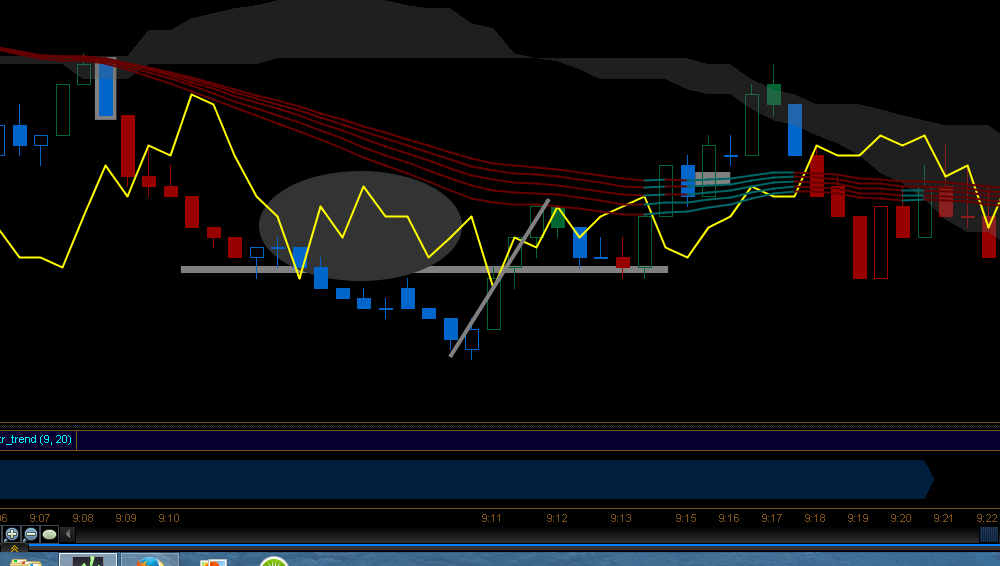
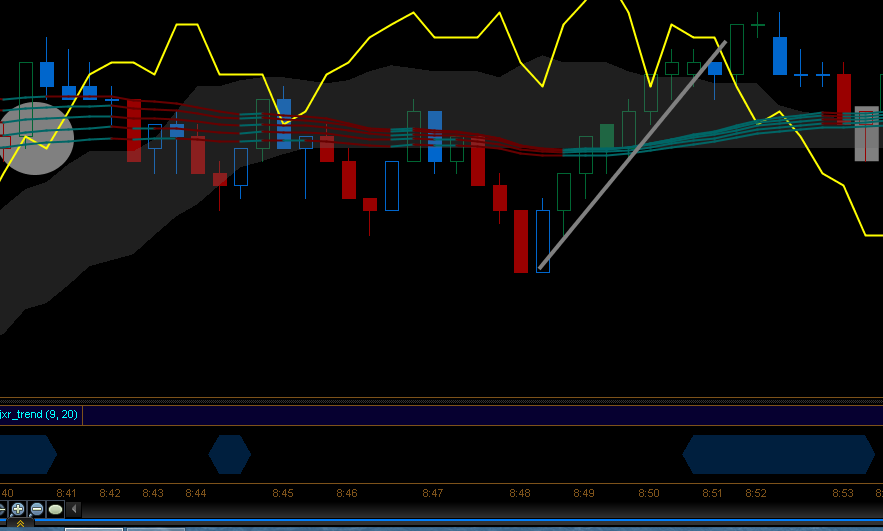
The highlighted candle on the left is the most recent entry; the one on the right is a reversal entry. I like the reversal because of the entire picture. 1- the oval illustrates that price got pretty extended from equilibrium. 2 – Price never picked up downward incentive once it reached the stall level. 3 – An upward incentive move, through the stall level, that holds with the advance into the EMAs.
There isn’t much room to the Kumo, but it’s a thin Kumo and there is enough room for a trade. In a spot like this I trail the stop tight once price gets close to the spanB. There will almost always be another entry if it turns out to be a good run and in the case where it breaks and runs on the first try I’ll probably not be stopped out.
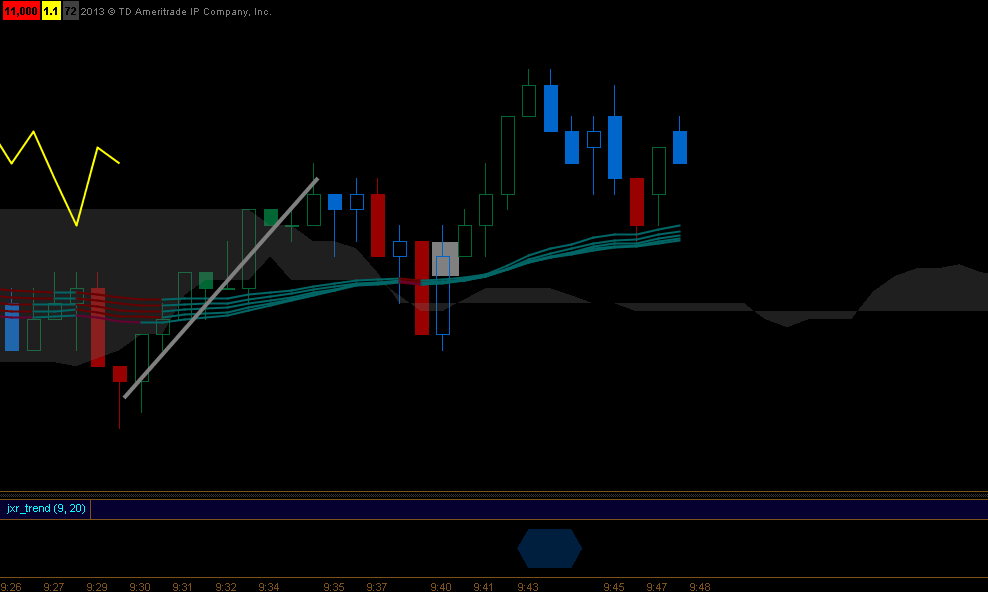
There is an incentive move & it does hold on the pullback but the picture does not look good enough. There really is no trend, from my perspective price in this zone is random. The second pullback is a little better but still it’s just not much of a trending environment.
Looks like I took a break too early, there was another nice set-up & move at 10:30. I was thinking that there had been quite a bit of movement & probably wouldn’t be much more at least until the afternoon. That’s just another reminder to trade what the market is doing not what I think it should – successful short term trading is about reacting, not predicting.