Ripple And Litecoin Are On The Move Now
Ripple Continues Its Expansion, Adds New Partners
Thirteen new financial companies joined RippleNet, which means that now Ripple has over 200 partners worldwide. The better news is that five of the 13 new additions will use XRP for liquidity. The five institutions are JNFX, Euro Exim Bank, FTCS, SendFriend, and Transpaygo. The other 8 will only use RippleNet for cross-border settlements.
Despite good news constantly pouring in, XRP’s price remained somewhat stable, without significant advances to either side and so far it hasn’t matched the bullish action seen on most other digital assets.
Chart Analysis – XRP/USD
Currently trading at 0.368 against the US Dollar (aggregate price, CoinMarketCap), Ripple added just 1.67% in the last 24 hours and 1.20% for the last 7 days. The pair has been stuck in a range between 0.40 and 0.35, which will have to be broken before we can see stronger movement.
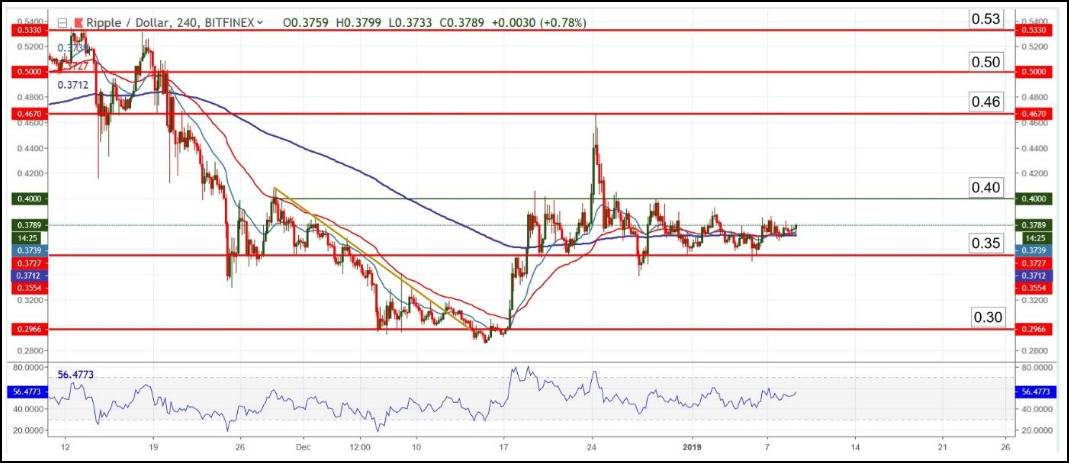
The support around 0.35 rejected price higher several times and it seems to be stronger than the resistance at 0.40 in the sense that each time it was touched (or briefly breached), the pair rallied faster than it fell when 0.40 was touched. However, that’s overanalyzing things a bit and the bottom line is that XRP is currently in a tight, choppy range, with a flat 200 period EMA, which supports this idea. Until a breakout occurs, price action will remain irregular.
Support zone: 0.35
Resistance zone: 0.40
Most likely scenario: move into the upper part of the channel created by 0.35 – 0.40; breakout uncertain
Alternate scenario: choppy movement inside the channel
Litecoin Tests Key Resistance And Psychological Level
Alongside TRON, Litecoin (LTC) is one of the best performers of the year to date, adding more than 22% during the last 7 days. Most top 20 cryptocurrencies are in the green, posting gains in 2019 but there’s no particular catalyst behind their rally except perhaps an exhaustion of the 2018 downtrend.
Litecoin on the other hand, just had an appearance in the UFC Octagon at UFC 232 – Jones VS Gustaffson 2 on December 29, 2018, becoming the first official cryptocurrency partner of the UFC. We could argue that the exposure it gained helped push its price higher but technical reasons contributed as well.
Chart Analysis – LTC/USD
Litecoin is presently testing the key resistance at $40 after briefly reaching a high at $42. The current rally started on December 28 of last year, which is very close to the time when the Litecoin logo appeared on the UFC canvas, so call it coincidence if you want, but what’s clear is that LTC is trading in a solid uptrend, albeit only from a short to medium term perspective.
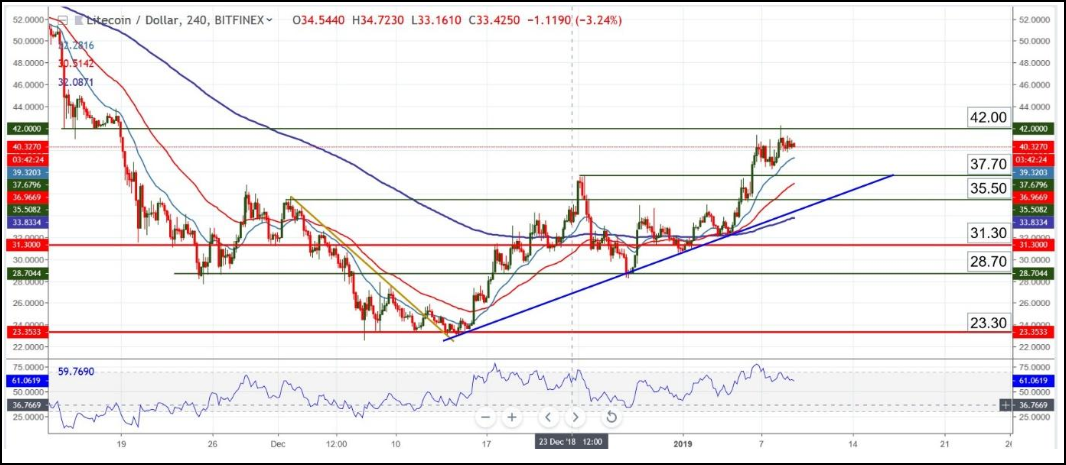
The resistance at 42.00 rejected price lower, sending the pair into 40.00 and the way price behaves here will offer clues for the next direction. A drop below 40.00 will make 37.70 – 38.00 the next target and a bounce higher will probably take price above 42.00, making 45.00 the next destination.
The Relative Strength Index is showing regular bearish divergence (price is making higher highs and the oscillator is making lower highs), which is a hint that a pullback will soon follow.
Support zone: 38.00 – 37.70 and the Moving Averages (20, 50 and 200)
Resistance zone: 42.00
Most likely scenario: retracement lower followed by a break of 42.00
Alternate scenario: break below 38.00 followed by choppy price action without clear directional bias