Red-Hot U.S. Inflation Sends Stocks Down, Triggers Bitcoin Volatility
Cryptocurrency Bonanza or Just a Flash in the Pan?
by Bogdan Giulvezan
Bitcoin performed a picture-perfect bounce at $37,500 and is up almost 15% during the last 7 days, but can it hold on to the gains? During the same period, Ethereum gained 11%, BNB added 10%, and Ripple 33%. Can we assume that the Crypto Winter is over? Maybe it’s too early for that, but it’s definitely a good start.
According to the Consumer Price Index report released Thursday, February 10, inflation in the U.S. rose by 0.6% during the last month and jumped 7.5% year-over-year, which is the biggest increase since 1982. The forecast was 7.3% for the yearly figure and 0.4% for the monthly, so these higher-than-expected figures sparked speculation that the Fed will be more aggressive with the rate hikes than originally anticipated.
Big players such as the S&P 500 companies don’t do well in high-rate scenarios and that’s why Thursday’s inflation data triggered a slump in stock prices. Bitcoin thrives in a risk-on environment, and Thursday’s data sent it approximately $2,500 lower; however, some of the losses were erased Friday morning.
Overall we can say that Bitcoin is not as affected by the surging inflation as stocks and indexes, which could be a sign of strength. On the other hand, BTC/USD showed rejection at the key $45,000 level, so we might be dealing with a so-called “flash in the pan”, a short-lived bull run… or a true reversal.
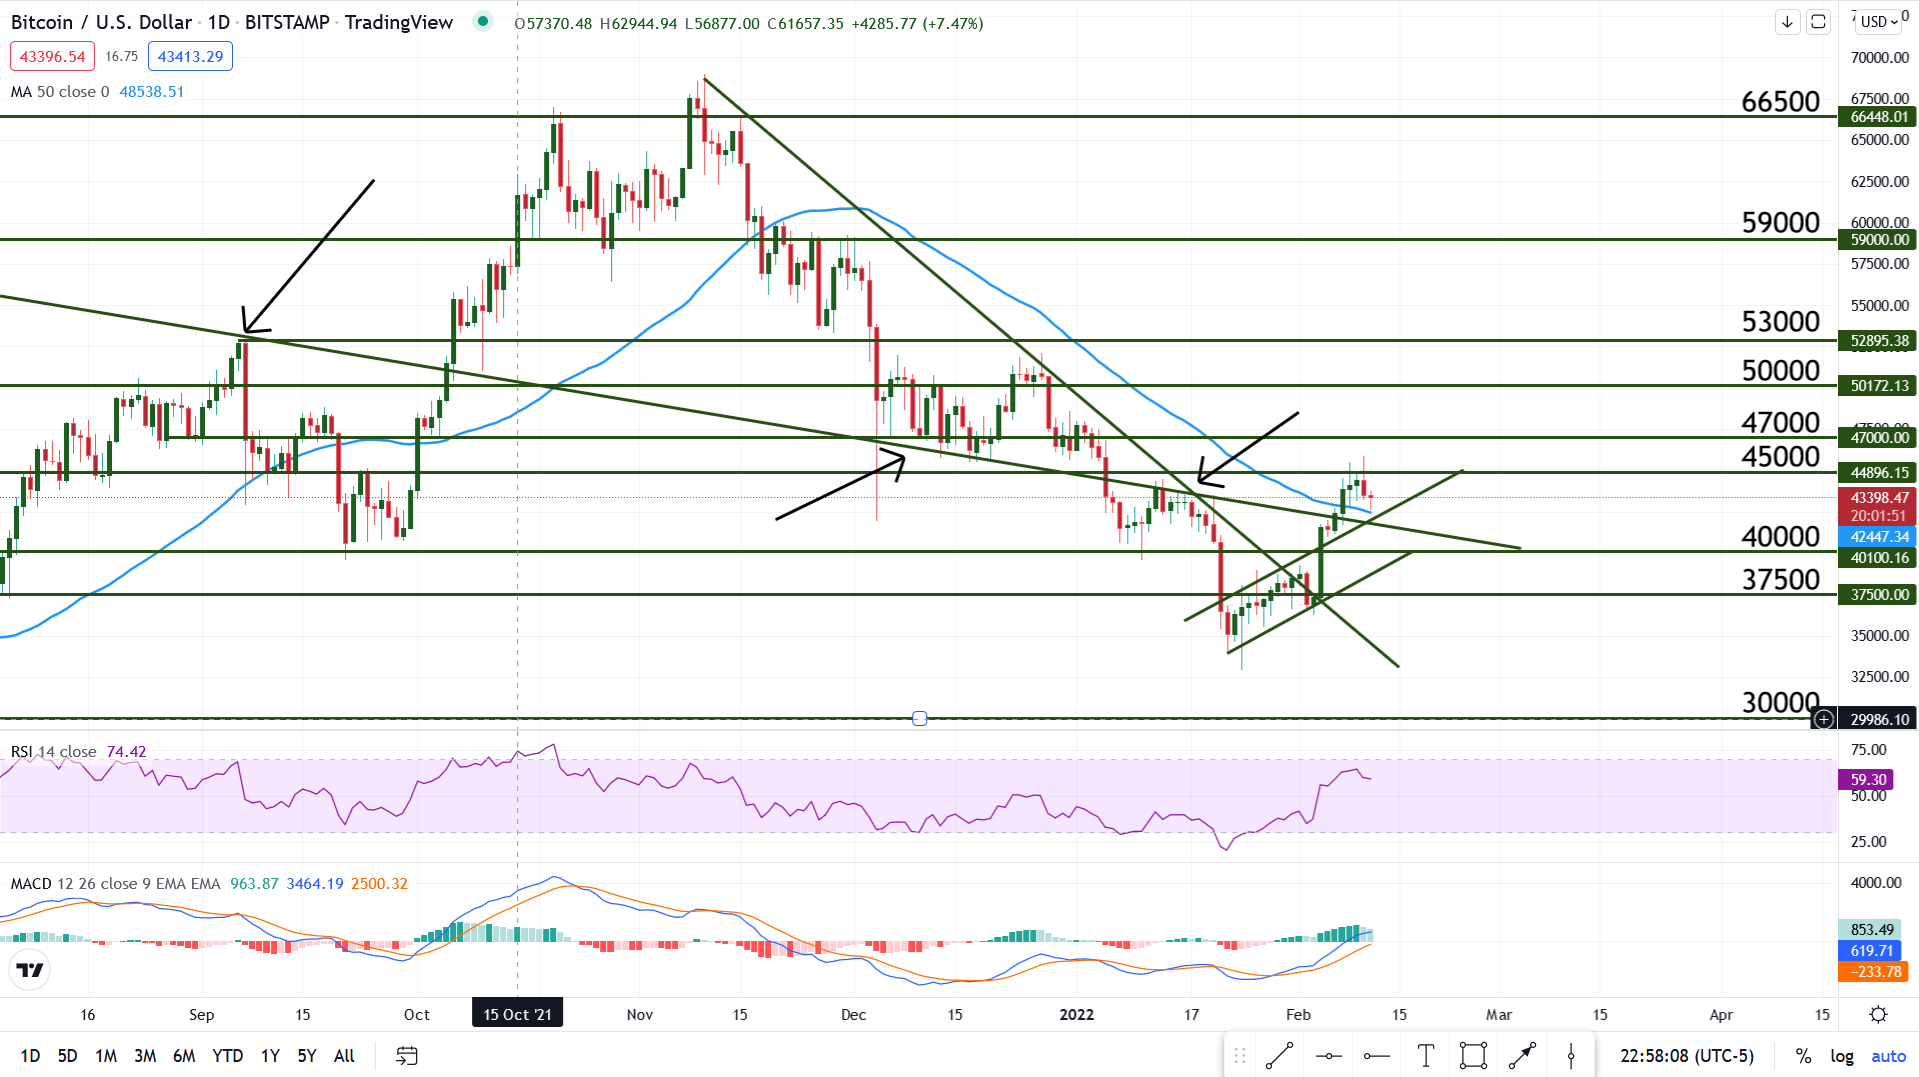
Technical Analysis – BTC/USD
The Daily chart below shows some interesting talking points, for both the bulls and the bears. On one hand, we see that the bulls managed to break the important confluence zone created by the long-term bearish trend line and the 50 days Moving Average.
Looking back on the chart, this trend line acted as support and resistance several times (as shown by the black arrows), which increases the importance of the bullish break. Another key aspect is that price also moved above the 50 days MA (blue line). This is a strong bullish signal, considering the fact that the last daily close above this line happened on November 17, 2021.
On the other hand, the rally failed to break the key handle at $45,000 and the candles started to show indecision (long wicks, small bodies). This could mean that the recovery is stalling, not necessarily that the climb is over.
It must be noted that price has strong support now, represented by the Moving Average, the bearish trend line that we just talked about, and also by the upper border of the diagonal channel. The next break is likely to indicate the next medium-term direction but caution should be used until something clearer transpires.