PayPal Opens Its Doors to Crypto. The Feature Goes Live in the U.S.
Paypal Goes Crypto
by Bogdan Giulvezan
As of November 12, 2020, PayPal’s news section reads: “We are pleased to announce that all eligible PayPal accountholders in the U.S. can now buy, hold and sell cryptocurrency directly with PayPal.”
According to the same press release, the waitlist for clients looking to use crypto is now gone and the limit is set at $20,000 per week; this limit was originally announced to be $10,000. Starting in early 2021, PayPal plans to allow clients to use their crypto assets to pay at PayPal’s 26 million merchants around the world.
PayPal’s CEO, Dan Schulman noted that “The shift to digital forms of currencies is inevitable, bringing with it clear advantages in terms of financial inclusion and access; efficiency, speed and resilience of the payments system; and the ability for governments to disburse funds to citizens quickly.”
The initial announcement to integrate cryptocurrencies on the platform was made three weeks ago and it led to a Bitcoin price surge, thus it’s very likely to see another price bump now that the service is live.
Currently, PayPal only offers the possibility to buy, hold, and sell Bitcoin, Ethereum, Bitcoin Cash, and Litecoin, but according to their press release, the plan is to add more cryptocurrencies as soon as possible. And to make things fully compliant with current laws, PayPal applied for and was granted a conditional Bitlicense by the New York State Department of Financial Services (NYDFS), an entity which is known to be hawkish when it comes to crypto adoption.
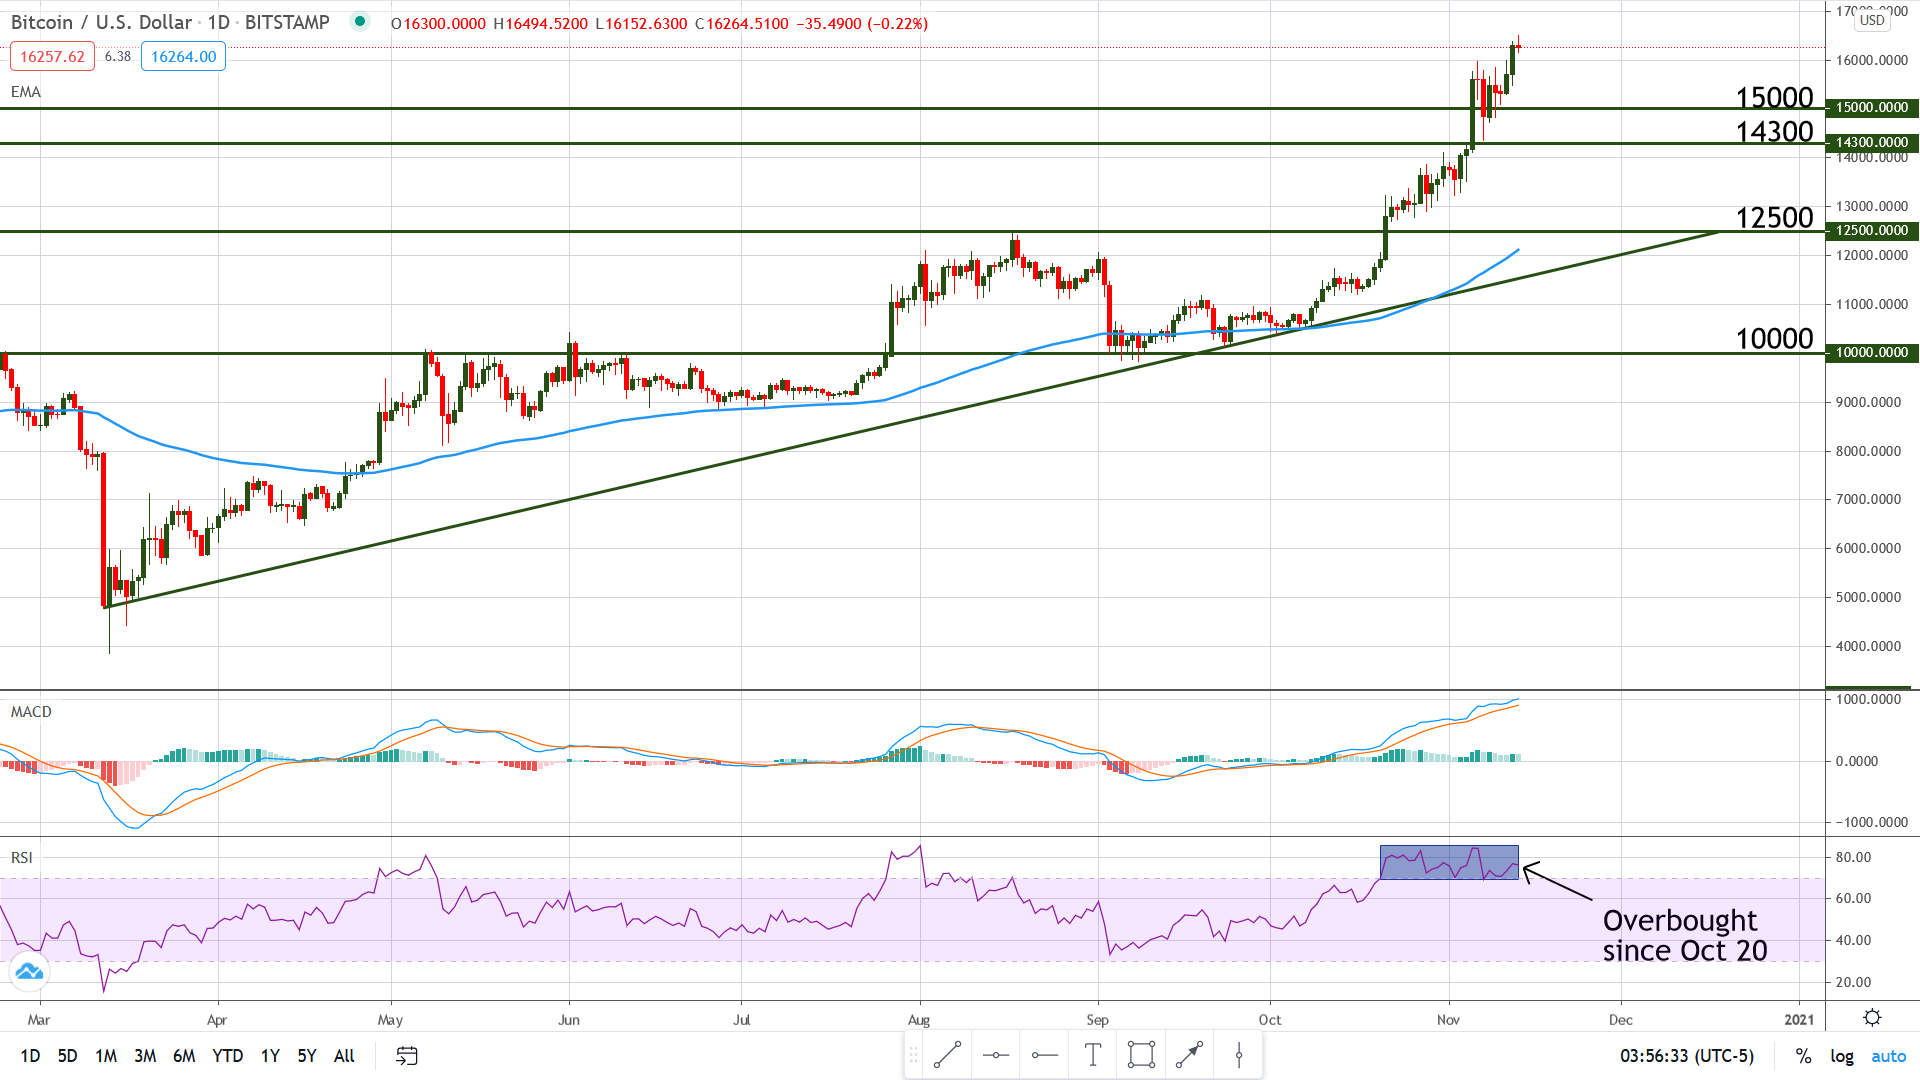
Chart Analysis – BTC/USD
At the time of writing, Bitcoin is trading at 16,340 against the US Dollar, with a bullish bias and 4.91% gains during the last 7 days, according to CoinMarketCap. The pair recently surpassed the very important resistance level located at $15,000 and has since returned to test the level (it moved below it then came back above it), thus effectively turning it into support.
The MACD is pointing upwards, which shows bullish momentum, but it’s trading at very high levels, which indicates that the current move is prone to pullbacks. Adding to this idea is the overbought position of the Relative Strength Index, which has been trading above its 70 level since the 20th of October (visible on the Daily chart below).
All this tells a cautionary tale: on one hand, we have a very bullish looking chart, with higher highs and higher lows (typical for an uptrend) but on the other hand, the indicators are telling us that price is overextended, thus likely to retrace lower or to enter a ranging phase. Considering this, the main direction remains up for the time being, but all big round numbers above current levels (i.e. 16,500, 17,000, etc.) may trigger a temporary move south.