Panic Buying Defies Overbought Levels, Sends BTC Close to 45K
BTC/USD Bulls Cautious Ahead of Critical Non-Farm Payrolls Report.
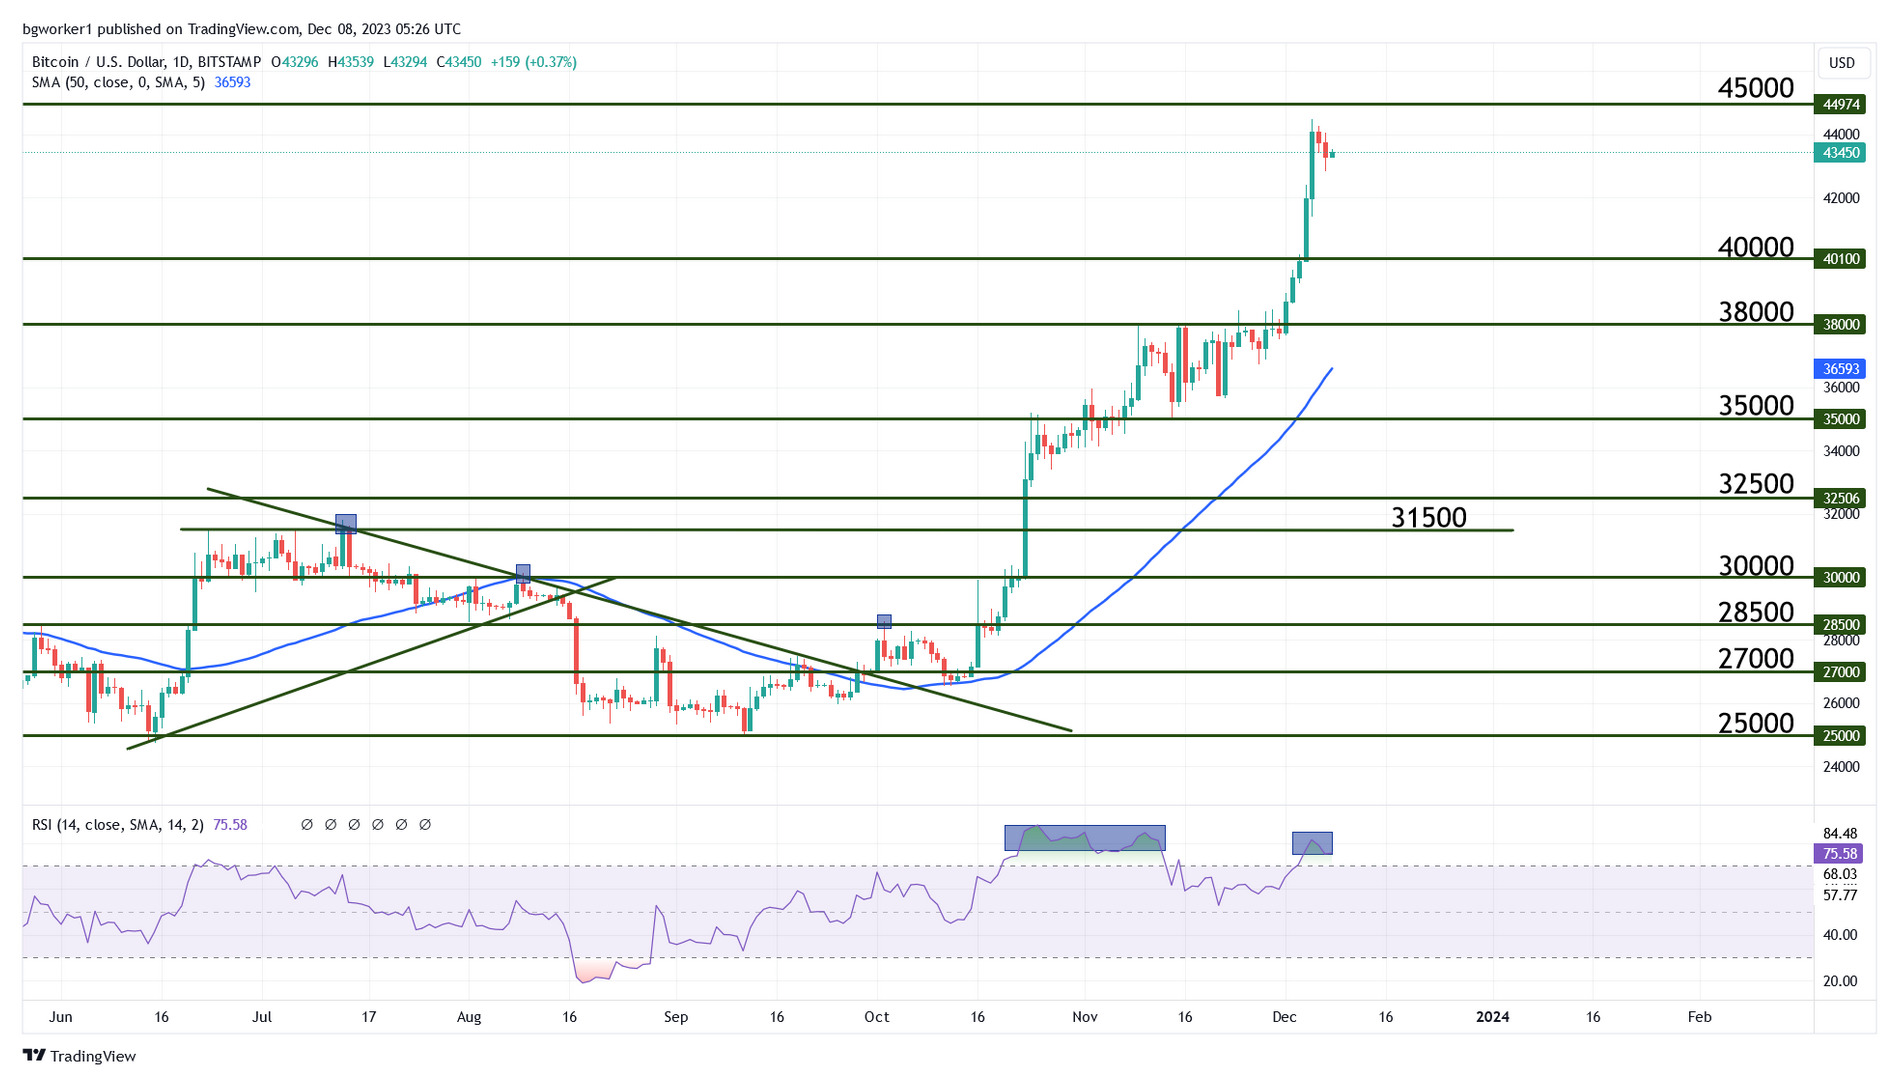
After a massive surge that saw Bitcoin rise as high as $44,490, the market started to cool off, in part due to profit-taking but also due to increased caution generated by the upcoming US jobs report.
Bitcoin whales have been an active driver of the rally that started in October, but as the price approaches the key level of $45,000, they may be switching to profit-taking. According to the Relative Strength Index, Bitcoin has been overbought on a Daily chart since 20 October. That was the beginning of its massive surge.
In other words, BTC/USD spent most of its recent climb in overbought territory, without a proper retracement. It did pause at $35,000 and $38,000 and even bounced a few times between these levels, but a notable pullback did not occur. Whales and regular traders who bought at the beginning of the rally may be trying to lock in some of the profits and by doing so, they will switch to selling, driving the price lower.
A cluster of data focused on the U.S. labor sector is due today at 1:30 pm GMT: the Unemployment Rate, the Average Hourly Earnings, and the ever-important Non-Farm Payrolls (NFP) report. It’s well known that jobs data has a strong impact on the US Dollar and on the Fed’s monetary policy. This may encourage some traders to skip the crazy volatility triggered by this release and secure their profits before the event. After all, why face a possible storm when they are already in profit? And remember that a buy position is terminated by a sell position, so we may see a bunch of buyers turn into sellers in the upcoming hours.
But always know that nothing is guaranteed in trading, and “the market can remain irrational longer than you can remain solvent” as John Maynard Keynes, a renowned British economist used to say.
Chart Analysis – BTC/USD
Bitcoin is currently changing hands at $43,380, after reaching a high of $44,490 earlier in the week. The recent climb that started after the break of $38,000 sent the RSI into overbought territory once again.
Comparing the two instances of overbought RSI, we can see that a massive bearish divergence is present. The price is significantly higher than it was the last time the RSI was above 70 but the actual indicator is lower than it was during its first trip in overbought.
When a potential retracement occurs, the levels to watch will be all BRNs (big round numbers) below the current price. Keep an eye out for bounces from $43,000, $42,000, and lower, if the pair gets there. On the upside, the level at $45,000 remains crucial for medium-term movement.