Bitcoin’s Rocky Ascent: Nearing $40K High
RSI Warning Signs: Long Time Bearish Divergence at Play.
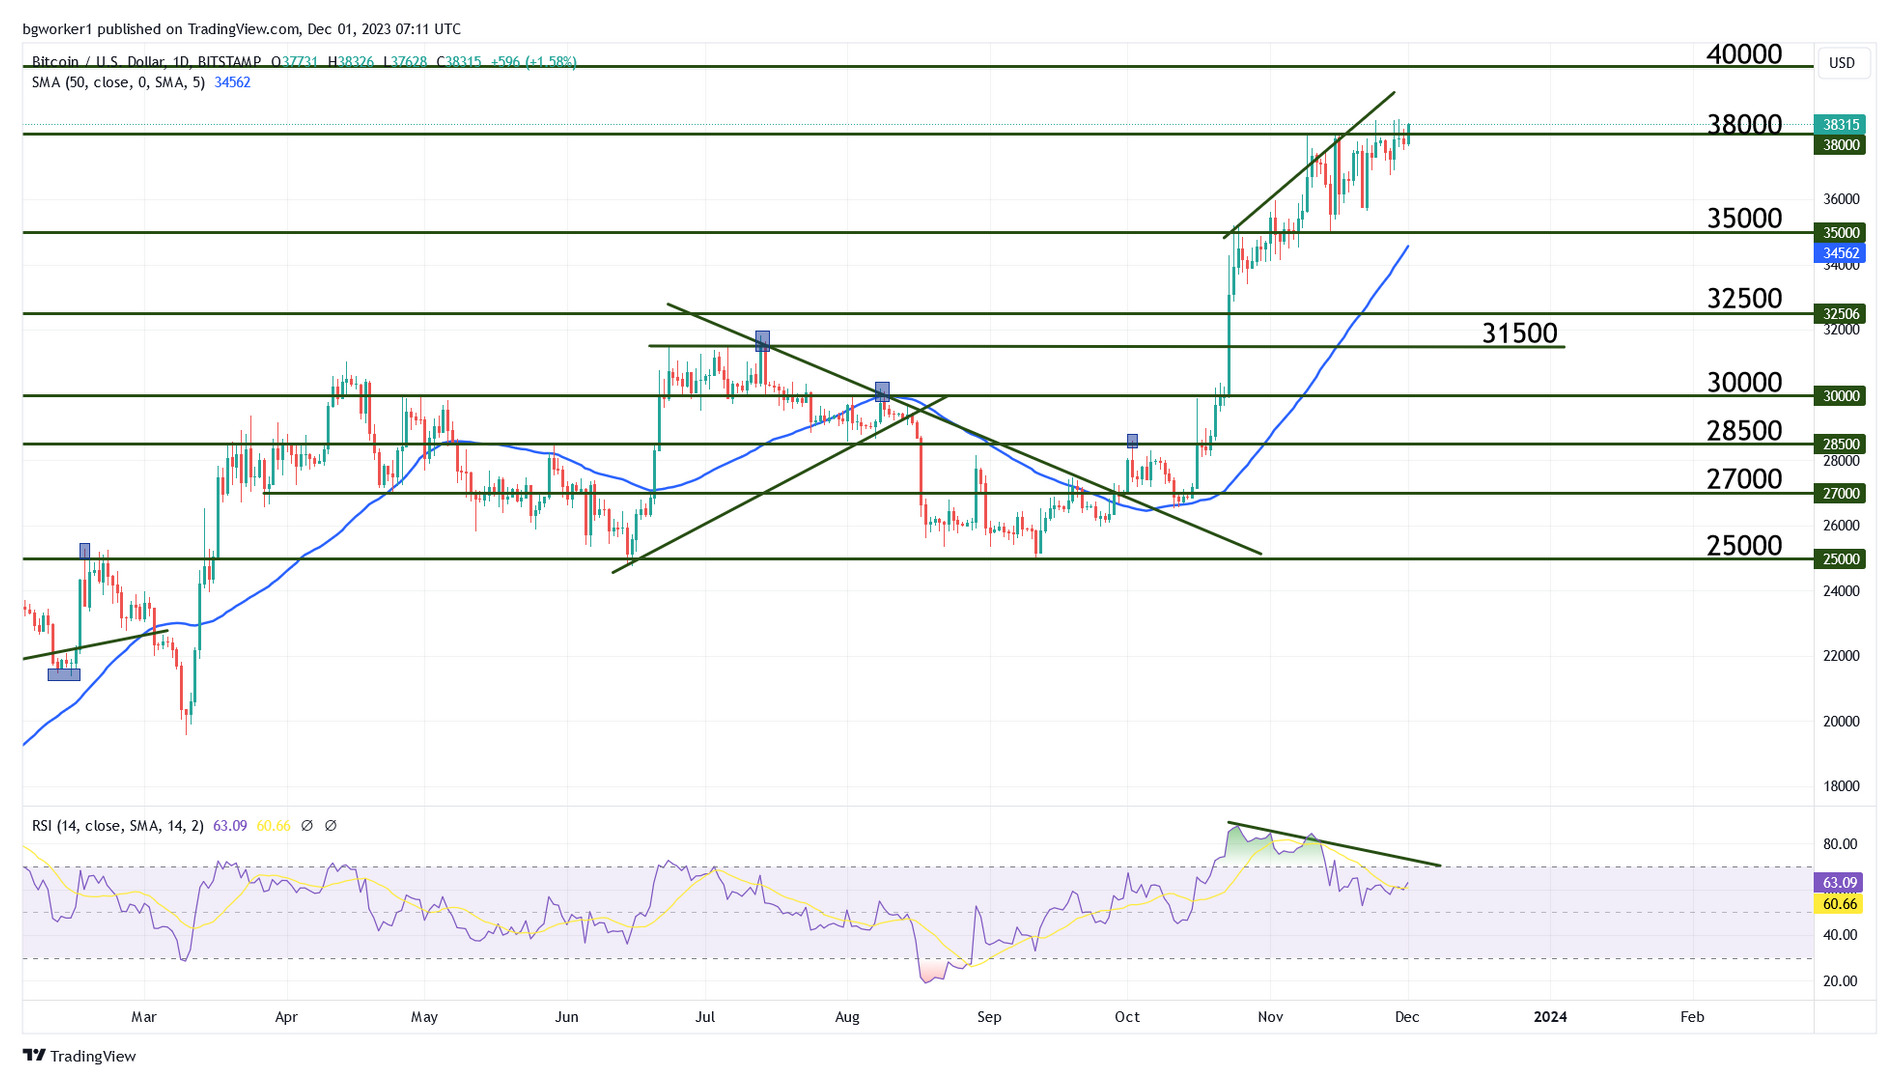
On Wednesday, Bitcoin reached its new yearly high, changing hands at $38,457. We could say that $40K is within reach but… not quite. Since 24 November, Bitcoin had several days in which it came very close to $39,000, and yet, the bears pushed back every time, creating a very choppy and uncertain trading environment.
At present, the macro scene is clashing with the technical side, which results in the cluster of back-and-forth action that we can see on the charts. The rumors about the approval of several spot Bitcoin ETFs are pushing the price higher, increasing optimism and overall market sentiment.
Major players such as BlackRock, Grayscale, BitWise, VanEck, Fidelity, Valkyrie, and more, have applied for spot Bitcoin Exchange Traded Funds (ETFs). The approval of at least one (but probably more than one) of these ETFs is very likely and the deadline is just around the corner: early next year. That’s how long the Securities and Exchange Commission (SEC) has until it has to give a verdict. The vast majority of crypto pundits agree that the verdict will be a green flag.
That’s where the optimism is coming from. So what’s the problem? Why aren’t we at $40K yet? Well, take a look at the chart, especially around the $27,000 mark. That’s when ETF optimism started to gain traction, and Bitcoin started to move in an almost straight vertical line. People who bought down there started to take profits off the table as the price increased. We can see a clear decrease in momentum around $35,000 and again around $38,000.
At or near these levels, buyers started to close their trades, turning into sellers, which hindered further advances. Let’s take a closer look at the technical aspect to find out what we can expect next.
Chart Analysis – BTC/USD
Since the first touch of $38,000 (November 9), price action has been choppy and a few candles showed long wicks, especially on the upper side. These are rejection candles, which indicate that bullish momentum is starting to decrease and that a pullback is in the works.
Something else that supports the idea of a drop is the RSI, which has been overbought since the first touch of $35,000. Looking at the lines drawn on top of the price and on top of the RSI, we can see they are going in opposite directions. I.e. the price is making higher highs and the RSI is making lower highs. This is regular bearish divergence and warns that a drop is coming.
Although the technical side favors a move south, keep in mind that news regarding the ETFs (or other major subjects), could sway the markets, and create chaotic movement.