Oscillators And Convergence Theory For Binary Options
This is the third in a series on how to use oscillators with technical analysis I have been writing. In previous posts I discussed what an oscillator is, two rules for trading with oscillators and how to use it to predict potential reversal. In this post I will go into more depth about convergences. To briefly touch base with the previous articles oscillators are a group of technical indicators with similar characteristics. This group is represented, but not limited to, tools such as the MACD, Stochastic, RSI and many many others. These tools are great for measuring market strength, providing trend following signals and marking support and resistance. Another thing they are great for is predicting break outs.
Yes, I said it, an oscillator can predict a break out. You can do this using convergence theory. In the earlier posts I described a divergence occurring when an assets price, on a price chart, makes a series of higher highs and higher lows while the oscillator makes a series of lower highs. Because the two are moving apart from each other they are said to be diverging, a sign of market weakness. This is true in both an uptrend and a downtrend and can be a remarkably useful application for binary options traders. It makes sense to think that if an oscillator can show market weakness it can also show market strength and that is what a convergence is. A sign of market strength.
- A convergence is when the oscillator, or other indicator, makes a series of higher or lower peaks in tandem with the underlying indicators. Convergences are signs of market strength and an indication of higher prices yet to come.
How Do You Use A Convergence
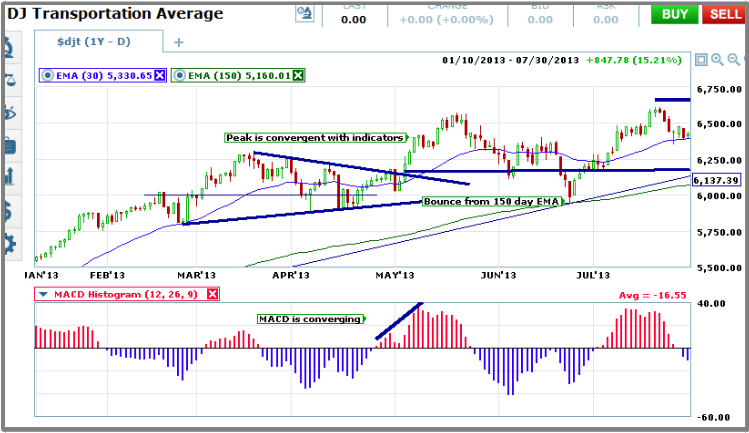
Convergences are one of my favorite ways to use an oscillator. They provide a much better signal than a divergence and usually lead to more profitably entry points. This is because a divergence is a counter trend signal, they can work but they are much harder to trade on. Convergences are a trend following signal and trend confirming signal. If an asset is trending up, with a convergence showing strength, we can assume that the trend is strong and will continue. Look at the chart below. As the Dow Jones Transportation Average creates its triangle pattern and breaks out it also makes two peaks in bullish MACD. The second peak is bigger than the first and thereby convergent. It shows strength in the market and indicates that the market is moving higher. The caveat is that it does not mean that it is going higher in a straight line. This convergence plays out over the course of three months and is a long term signal for this chart. The subsequent bounce from the 150 day EMA, at the precise spot that it also touches the long term trend line, is a great entry for daily, weekly and monthly binary options expiry.
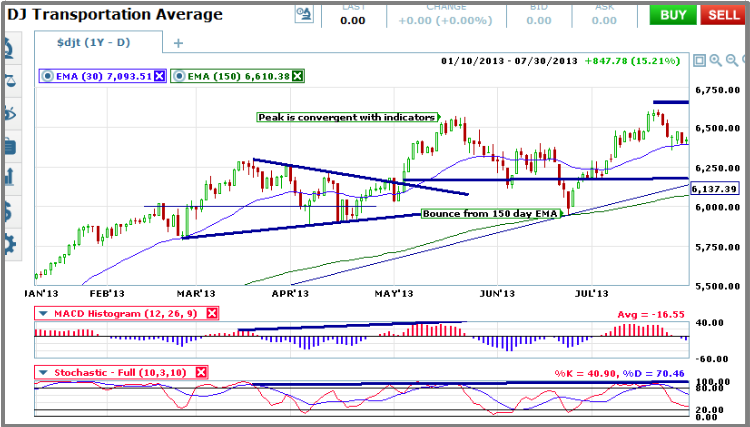
Now let’s look at the same chart again. There is also at least one short term divergence that can be traded one successfully. Look at where the Transports are breaking out of its triangle pattern. The MACD first makes a small peak as the index begins the break. Then, as it breaks free of the triangle the MACD begins to make a second peak. Binary trades with an hourly, daily or weekly expiry could be entered as soon as the MACD’s second wave becomes higher than the first. That is the first short term convergence. The second occurs as the break out makes it’s first peak. This peak is convergent with the rising MACD as well and indicates higher prices to follow. During the brief consolidation that occurs binary options with a daily or weekly expiration are appropriate (this is because the trannies are also approaching a resistance target but that is another article altogether.
Things To Remember
First, oscillators and convergences are fantastic tools for binary options traders. Second, the convergence signal is much better than the divergence signal. This is because the convergence is a trend following sign of strength. Third and perhaps most important, convergences are great trend following indicators but they do not necessarily mean that the trend is going to continue right away. The market never moves in a straight line, pull backs and continuations are common events. It is wise to await another trend following signal before making your entry in order to get the best results. I suggest using support and resistance, moving averages and trend lines to help clarify any signal given off by an oscillator.