Naked Trading
Good day traders, hope your Monday has been profitable! I’ve been reading a bit more on naked trading, or “indicator free” trading. I’ve really been drawn to the idea of trading with minimal amounts of indicators, and I’m beginning to see why you don’t need indicators. I am beginning to gather information from various professionals and forums about indicators, especially ones that claim to tell you the direction of the market with high accuracy, simply cloud your vision of the market. Just think of it as having a dirty windshield that’s hard to see what’s on the other side, dirt is the indicators, and the dirtier it is the less you can see of what’s really happening. Your windshield wipers are used to clean off your dirty windshield, so you can see clearly again, right? So wiping away the indicators can help you see what’s really happening in the markets. The charts you see in front of you serve as a window into the market, and I think its best to keep your window clean, or at least mostly clean.
I would recommend all new traders do, is learn some of the most beneficial basics in trading. Support/Resistance, order flow, Price Action (what is happening in front of you based on candlesticks, etc.) Now don’t think this is all you need to learn, its just what I think is good for a new trader to start with, because it will serve as your most valuable knowledge with anything to do with trading. This is due to the fact indicators and other advisors and such are designed on “price action”, the problem with them is they are always lagging, so by the time the indicator gives you a signal, its too late to enter usually. If you can learn Price Action without indicators, then you can identify a trade earlier, and feel better about your entries because you understand why. I believe price makes major moves because the institutions are dumping money in the markets to move price in a direction they desire, and they manipulate price to confuse the bulls and bears into thinking something will happen, so they can fill their (institutions) orders and make profits. The Forex market is a tricky place, full of very smart people, and they know how to prey on new inexperienced traders, and it happens every day right in front of you, you just have to learn how to see it. If you can learn how to see when the big guys make a move, then you can trade with them and profit how they profit, piggyback if you will. So, that’s it for my small lecture, dig deep in some of these topics, and you won’t be staring at the charts with no idea of what’s going on.
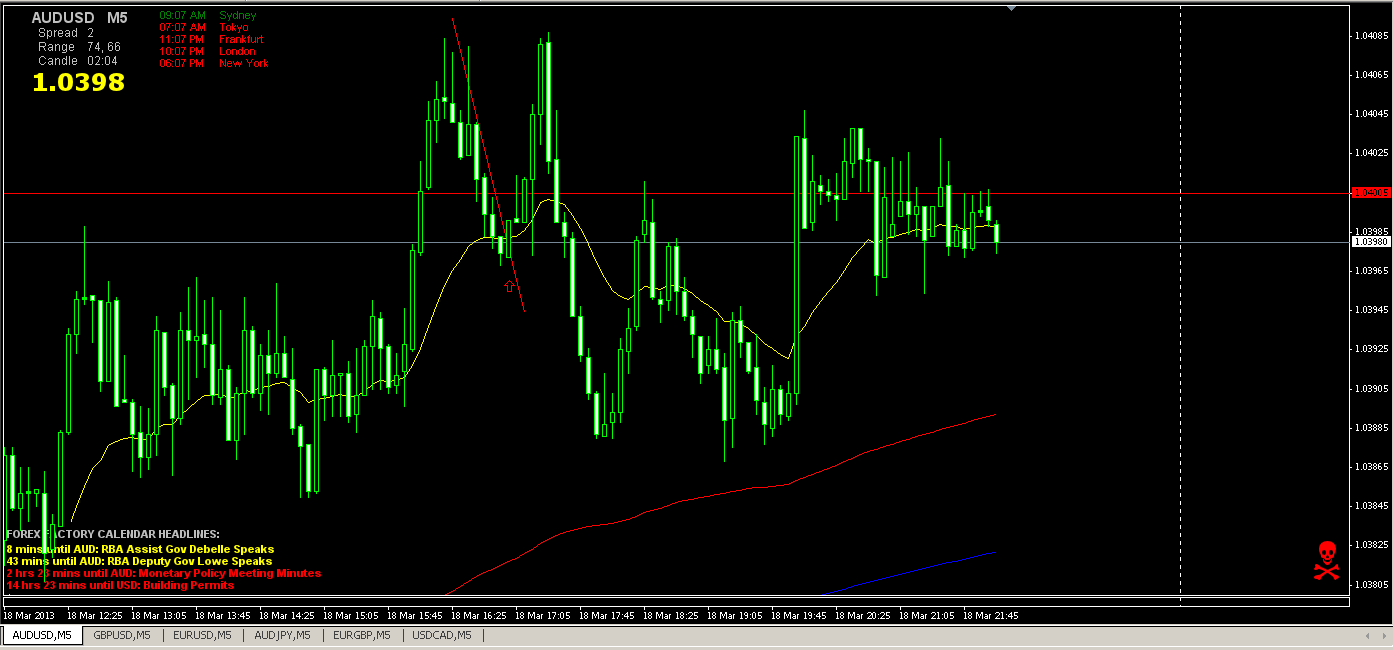
My first trade today was around lunch, and while I was on break I took a glimpse at the charts and found a setup that was about to trigger, so I got ready. It was with AUD/USD, and price was making a sharp move up, all the way to 1.04075. Around this area was resistance, as you can see by the pin bars and doji’s present. Shorty after, price was making a correction and returning back down towards the previous consolidation. Price reached the 20EMA and held, so I drew a line along the downtrend, and once price broke through my line, I placed a call. The line is to help me see that price is reversing, and I constantly update the position of this line to accommodate pullbacks and such, and the candle must close through the line before I enter. This trade was ITM. Remember the KISS method.
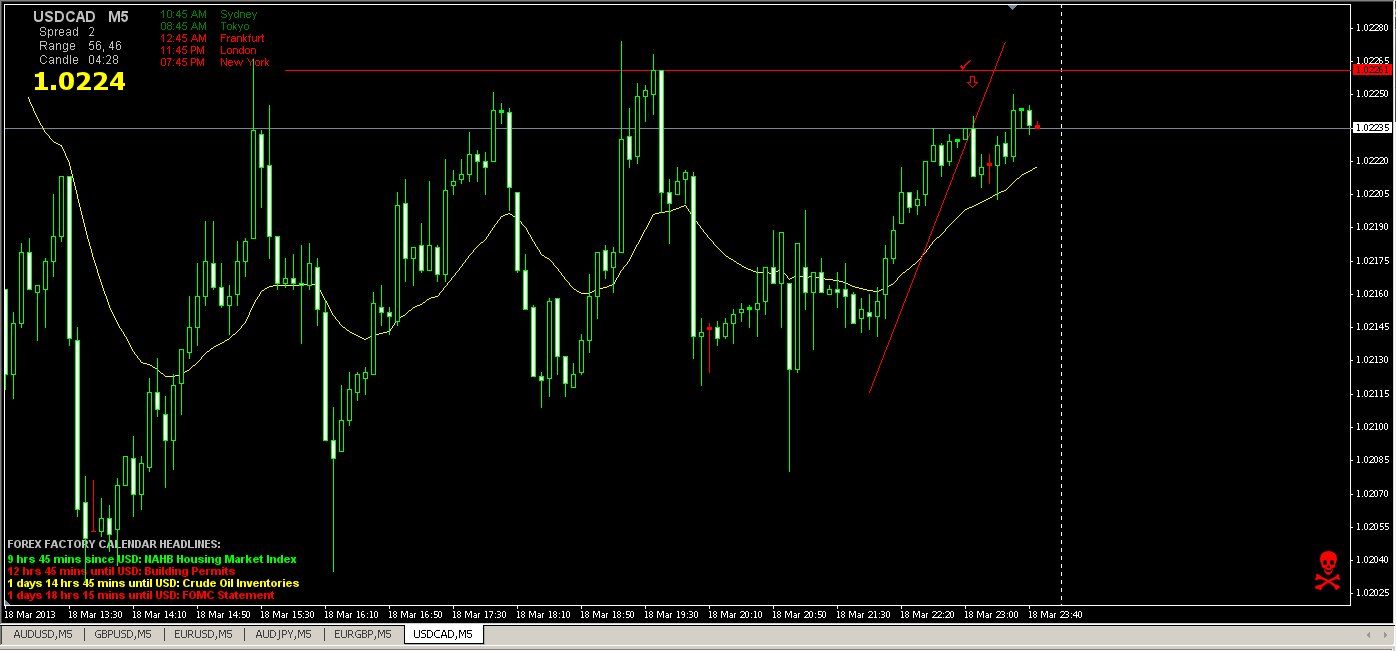
My second trade was with USD/CAD, and as you can see it was in a bit of a slight up trending channel, or it could be considered ranging. Anyways price was moving up I was waiting for a significant pullback to trade off of. Price reached some previous key levels and began to make a large bearish candle quickly, this is where I entered as it crossed through my line as it was returning back to the 20EMA. Price eventually returns to the 20EMA (rubberband strategy), and I use this in confluence with other psychological levels in the past to aid my trades. This trade was ITM.
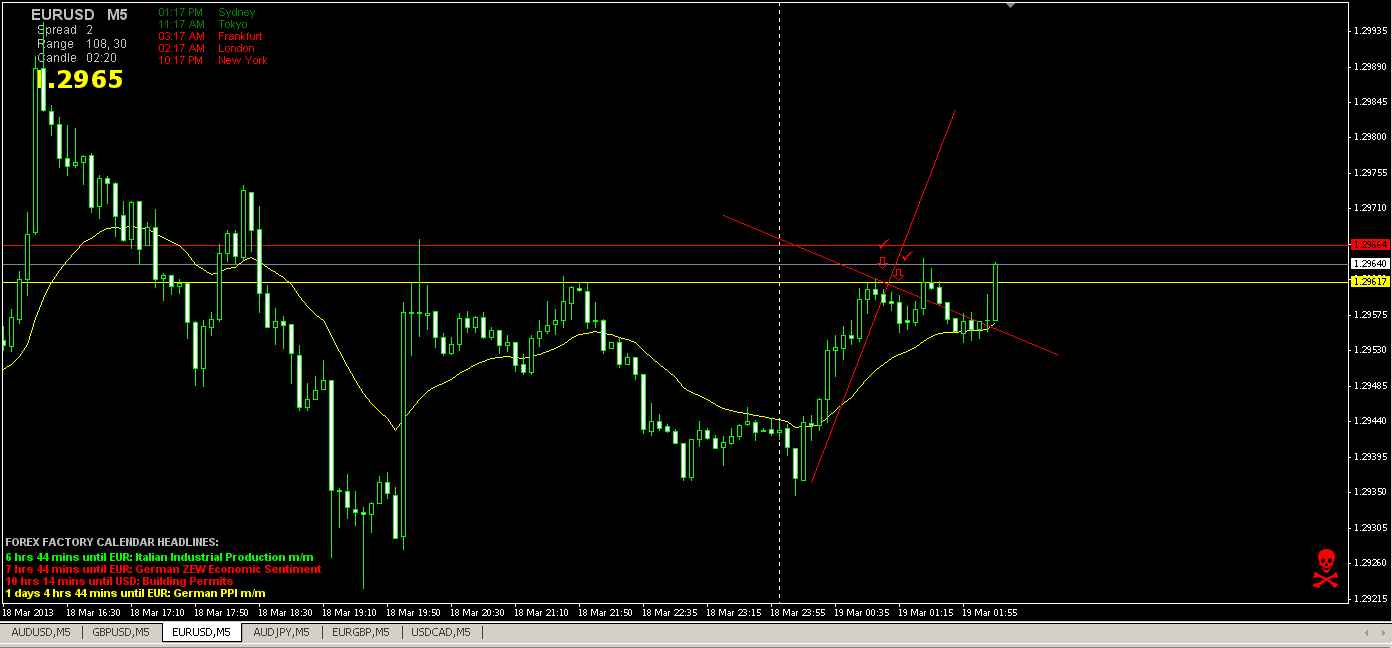
My third trade was with EUR/USD, and price was in somewhat or a range on a high TF, so I looked back for key levels in the past, and waited for price to reach these levels. Price came up to some significant resistance levels in the past, so I waited for my trade to trigger here. I drew my line and waited for the break of it to enter a put. Since price was away from the 20EMA I knew it would return to it sooner or later, and at these key levels it seemed likely it would try it here. I entered a 5 min put here and it was ITM. My fourth trade was place shortly after the third, and I drew another line horizontally so if it broke though up, I would enter a call, but if it stayed below, I would place another put. I entered right after the doji before the large bear candle the second arrow is pointing to. This trade was ITM.