My Approach to Forex Trading: #3 (Breakout trades)
Those familiar with my blog here know that I tend to pretty much always stick with an overarching trading strategy centered around support and resistance levels. For binaries, that continues to be true. I have tried breakout strategies in the past for binary options, but I’m simply not very good at it to be perfectly honest. Some binary traders might be great at trading breakouts, and perhaps center their entire strategy around breakout trades. But each person is different and trading the exact same strategy as another trader may not work for you, no matter how hard you try to emulate what he or she may happen to be doing.
For forex trading, basing my trades around support and resistance – with rather heavy reliance on Fibonacci retracement levels – is still my main strategy. But every now and then, taking a breakout trade can actually be a good idea. The thing for me is that in forex, it really doesn’t matter how accurate you are in your trades. This is unlike trading strike-entry binary options, especially under something along the lines of a fixed-investment money management plan. In forex, what truly matters is your reward-to-risk ratio and how you manage your trades overall. If you’re aiming for a 2:1 reward-to-risk ratio on average – i.e., your take-profit margin is twice the size of your stop-loss margin when measuring from the price you entered your trade at – you only need to be correct on 33.3% of your trades just to break-even. Even being right on only 40% of your trades can reap a strong profit margin.
The point of the matter is that I can take breakout trades without worrying too much about whether it’s going to be right or wrong. If it’s wrong, I simply lose whatever I have stop-loss set at. If it’s right and the market is about to make new highs or lows that haven’t been seen in a very long time – or perhaps ever in the history of the currency pair – the possibility of profiting on such a circumstance can be enormous. Sometimes, these trades can be predicted using macroeconomic events, like when the USD/JPY steadily increased after the Bank of Japan announced the country’s quantitative easing efforts. That’s practically always synonymous with depreciation of a nation’s currency. Hence, the JPY lost value and the USD/JPY exchange rate increased.
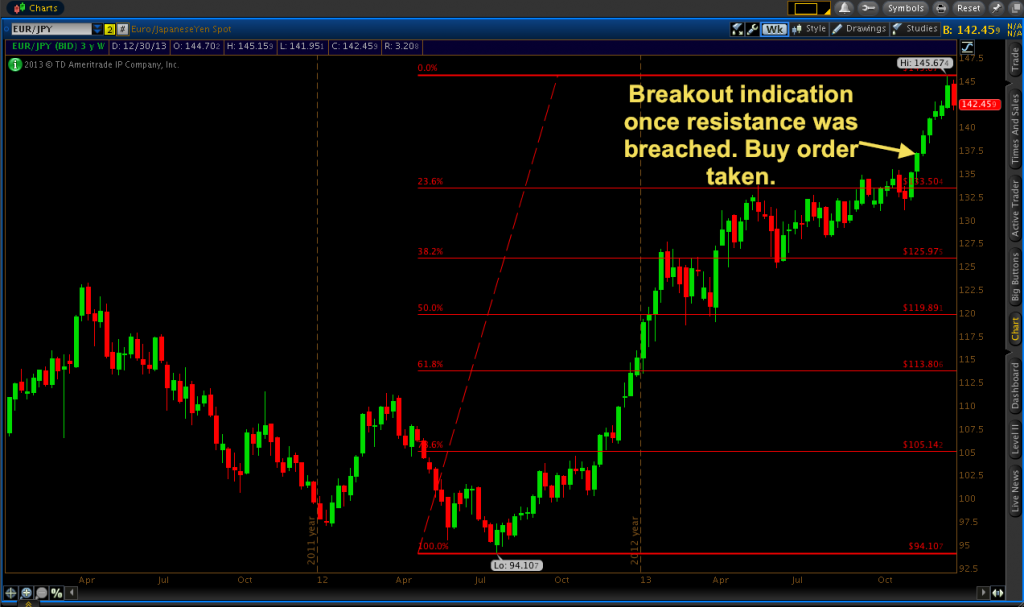
Here’s an example of a recent breakout trade I took occurred on the EUR/JPY. The Fibonacci retracement levels I have drawn in span from 94.107-145.674 (currently), and from 88.940-169.960. The latter is a larger price movement stemming from a very large timeframe high and low from the years 2005 and 2000, respectively.
However, when the actual trade was taken, I had the 88.940-169.960 Fibonacci levels drawn in, but Fib levels drawn from 94.107-135.493. I took the trade at the end of the day on November 22, roughly at 136.400 when it became clear that the EUR/JPY was finally breaking out of the consolidation pattern that had formed resistance in the upper 135’s.

View from the weekly chart:
And unlike in the basic support and resistance trades that I make, I don’t use take-profit levels during breakout trades. The reason for this is that there is simply no clear price at which you can expect the pair to reverse. So I simply use trailing stops instead. Trailing stops are a tool in which you basically reset your initial stop-loss by placing it higher when the trade is going in your intended direction (in the case of buy orders).
My strategy for trailing stops is simple. I basically set it at some price beneath the previous day’s low. My initial stop-loss was placed at 134.800. This isn’t something I determined scientifically or in terms of some personal formula. I simply used a price back in the consolidation area while still giving my trade some wiggle room to develop (160 pips).
Once my trade finished at 138.711 on November 27, I moved my stop-loss up significantly to protect some of the profit. This is essentially a means of rewarding oneself for making a correct educated guess on the future direction of the market. The low of November 27 was 137.281. So I placed my trailing stop up at 137.250, a price just underneath. By doing so, I guaranteed myself that my minimum margin of victory on this trade would be 85 pips (excluding the spread, which is usually two pips or so).
I did monitor this trade closely because the EUR/JPY was fast approaching the 38.2% Fibonacci retracement level from the 88.940-169.960 price range. This is a very large price range that literally encompasses decades’ worth of price movement on this currency pair. Hence, any Fibonacci level from this price range can be expected to have some type of influence on the market in terms of price congestion. The next day, price went above the 38.2% level and I adjusted my trailing-stop another 75 pips higher. But fortunately for the trade, price continued to stay above the 38.2% level and actually used it as a support level to consolidate and eventually continue to make new highs as more buyers entered the market.
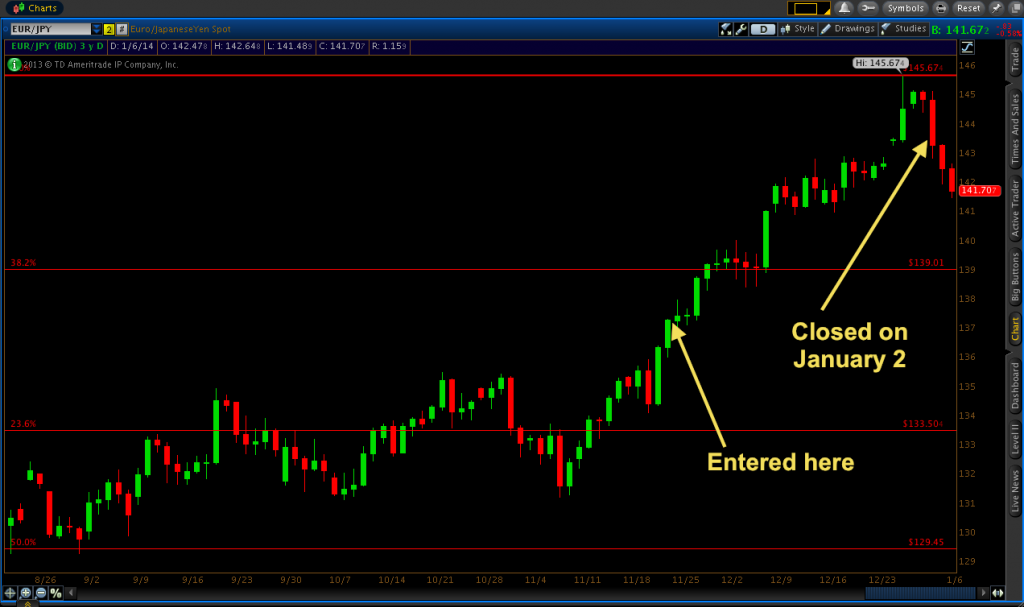
View of the trade from current Fibonacci levels in place:

This trade cooperated very well until my trailing stop of 143.300 – set underneath the low of the December 27 candle – was triggered on January 2. This proved to be a good way to exit this trade as the EUR/JPY has been retreating from the late-December highs ever since.
Overall, this is one of my favorite trades so far in my forex career. Breakout trades come pretty infrequently when trading from the daily chart, but when they do they can be very rewarding. I walked away from this one with 690 pips of profit after holding the position for six weeks (although I always close trades over the weekend).