Mitsuboy’s Trading Strategy
Summary:
My trading style is simply based off of price action, whole numbers, daily Fibonacci levels and daily Fibonacci pivot points. I analyze charts to find significant levels at which price will reverse. The only indicators I have on my charts are the Value Chart, 62 EMA, and 200 EMA. I almost never take trades solely based off these indicators but I use them as confirmation for my trades and overall trend direction.
Price Action:
The biggest common misconception with price action is that it’s trading based off of candle stick patterns/formations. If that was the case then it would’ve been called candle stick action. Candle stick formations are a byproduct of price action! I’ve had countless OTM trades because I entered on the formation of a hammerhead candle but if I would’ve gotten in at the bottom of the wick it would’ve been ITM. The problem with candle sticks is they’re different for every timeframe (this is also an issue with indicators), and not all traders use the same timeframe. On the other hand, price is the same on all timeframes. The whole idea of price action is to determine at which price there are going to be a significant amount of buyers/sellers.
Whole numbers/Round numbers:
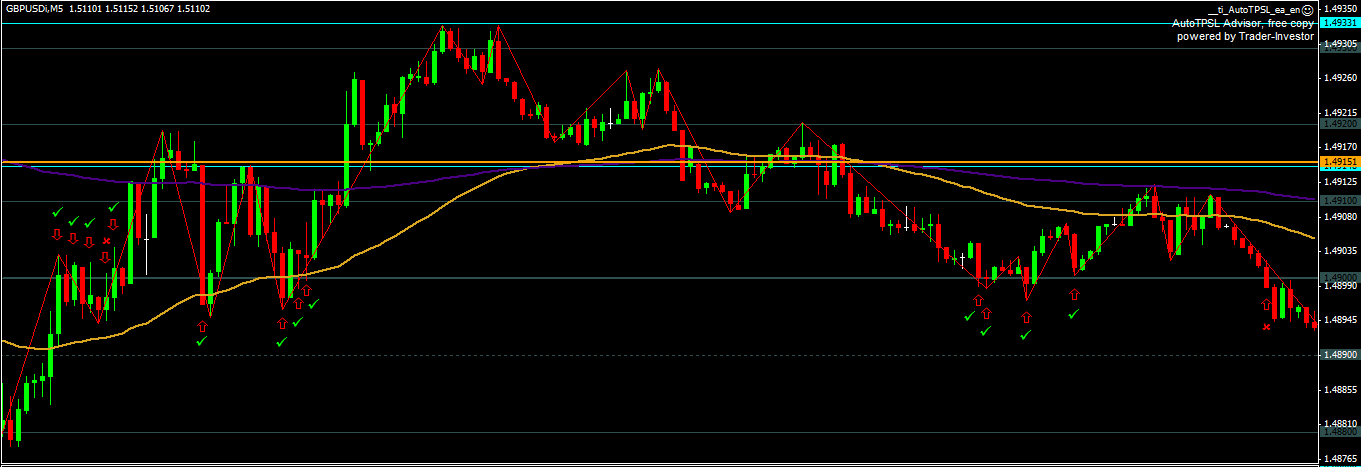
I recommend for every trader to load a whole number indicator on their charts, I use SweetSpots.mq4. In my opinion, a lot of traders undervalue the importance of round numbers. The round numbers (example EUR/USD 1.3100, USD/JPY 96.00) are natural levels of support and resistance. A lot of orders are placed around these levels. That is why when the market approaches such levels the price movement is countered by these order flows and small retracement usually happens. You can see in the picture below that if you would’ve taken trades based off of every touch of the round number 1.49000 on GBP/USD you would’ve been 12/14 ITM.
Fibonacci Levels:
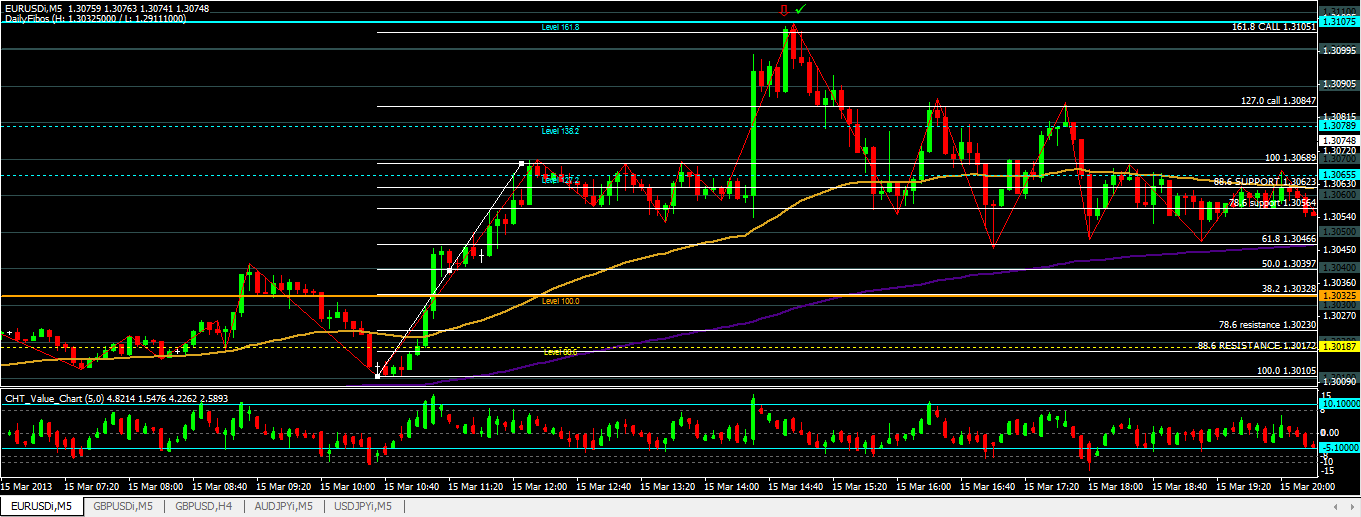
Fibonacci levels have proven time and time again to be valid areas of support/resistance. I like to use the daily Fibonacci indicator. It draws fib lines based off of the previous day’s high and low. I’ve noticed that the strongest and most valid levels for daily fibs are the 0.0 (previous day low), 100.0 (previous day high), 61.8, 161.8, and -161.8. When price hits these levels the chances of a reversal are very likely. Occasionally I use the Fibonacci drawing tool, which I draw from the previous high to the previous low of the most recent trend and take trades based off the 50.0 and 61.8 level or the 127.3 and 161.8 levels. I only take trades off these levels if there’s confluence. In the picture below price hit 161.8 Daily Fibonacci line (thick teal line) and it hit the 161.8 fib based off the previous low and high. This trade would’ve been an easy ITM.
Fibonacci Pivot Points:
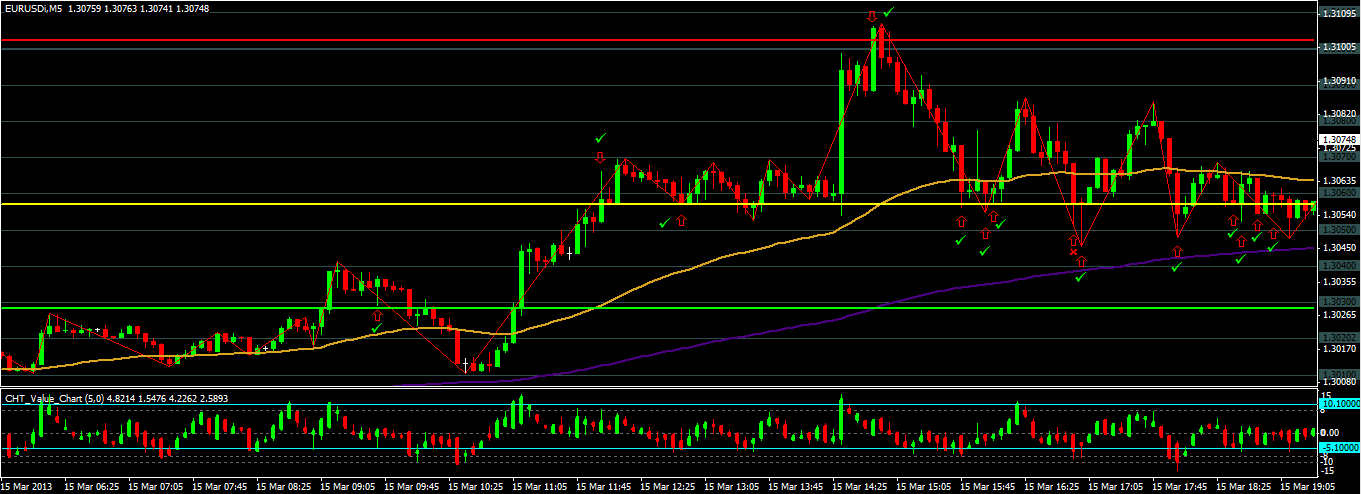
Fibonacci Pivot Points are significant levels traders use to determine directional movement, support, and resistance. I like to use them as possible reversal areas but mores as dictating where price will go. Once price breaks above pivot I expect for price to test R1 as resistance. If it breaks through the R1 line then I immediately know price is in a pretty strong uptrend. After the break of R1 I’ll wait for price to retest R1 to take a call and once price touches R2 I take a put. If price breaks R2 then I wait for the retest to take a call and then the touch of R3 for a put. The same is vise-versa if in a downtrend except its S1, S2, and S3. Trades taken based off these levels should always have confluence in order to ensure a higher probability of it being ITM. In the picture below notice how price broke through R1 (green line), if you would’ve taken a call based on the retest it would’ve been ITM. Price broke down a little but then quickly broke through R1 again, this time it never retested it as support. If you would’ve taken a put on the touch of R2 (yellow line) it would’ve been ITM. It broke past R2 which means you should take a call on the retest which would’ve been ITM. Price then quickly exploded upwards to R3 (red line) where you would’ve taken a put which would’ve been ITM. Notice how R2 acted as a strong support after the touch of R3. If you would’ve taken a call based on every touch, it would be 9/10 ITM.
The Art of Putting It All Together:
Now the key to being successful is being able to put all these strategies together and using them as one. This may take some time but once you get the hang of it, reading charts will become second nature. I also want to point out that you have to be patient for price to touch these levels. Don’t get in a trade just because it’s close to the level, you’re going to get burned. If you miss the touch of a level do not get in after it’s already wicked or moved in the opposite direction! You’ll have plenty of more opportunities during your trading session. ALWAYS REMEMBER THIS: Don’t chase price, let it come to where you want it.