Market Correction, It’s Here, Embrace It
The Market Is Moving Lower
There are a lot of reasons to think a market correction is coming (happening) but the number one is trade. The global trade environment has been disrupted and the disruptor, Trump, isn’t letting up. If anything, he’s intensifying already hardline tactics in an effort to force change. The latest salvo, a 5% tariff on all goods coming from Mexico, could be the straw that breaks the camel’s back in terms of global economics, it is for sure the event that is sending the U.S. ten-year treasury to new lows.
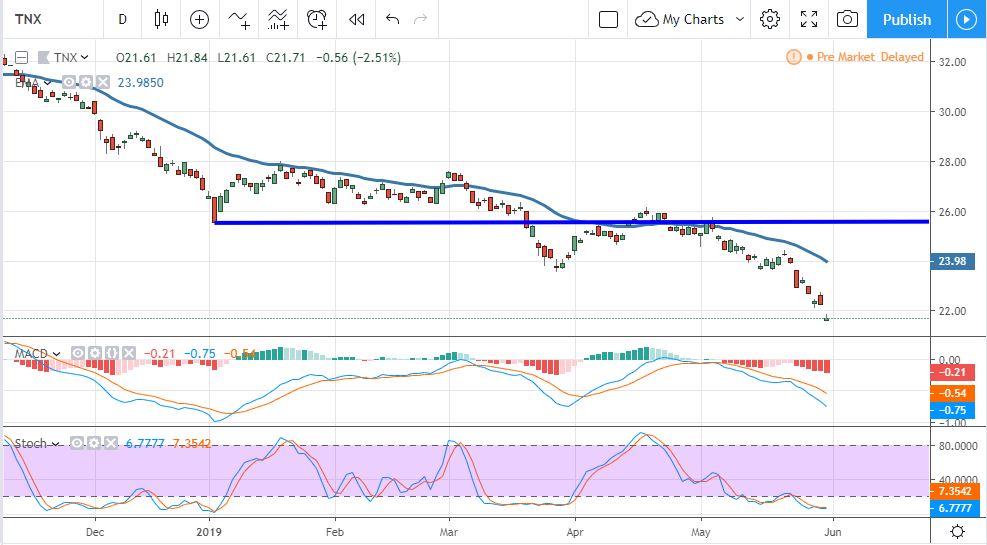
The U.S. ten-year Treasury yield fell to a new 20-month low. The new low deepens the spread on an already inverted yield curve and signals impending economic recession. The yield-curve, as an indicator of recession, is nearly infallible although its timing is questionable. A look at the ten-year yield chart suggests the inversion will remain in place and may even deepen.
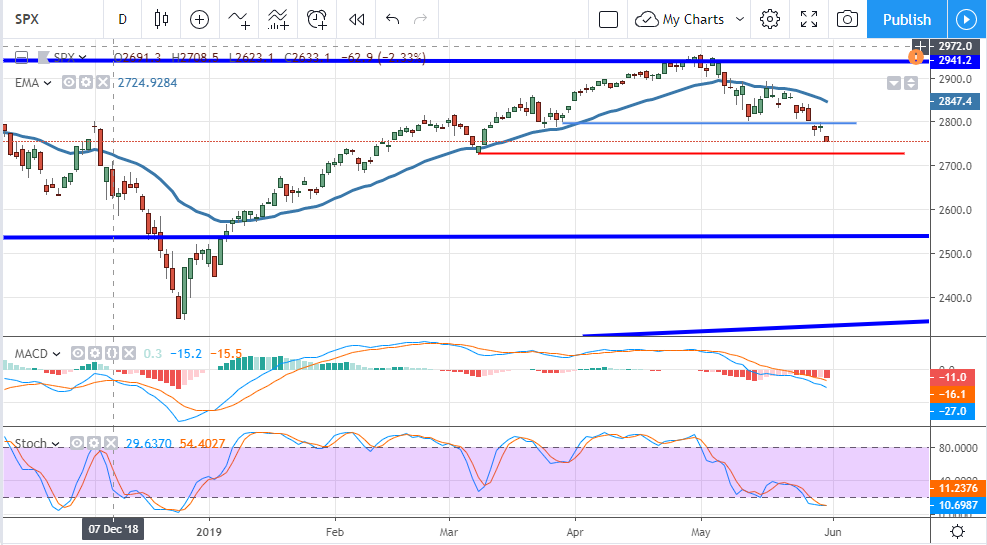
The S&P 500 is now trading at a 2.5 month low and indicated lower. The candles themselves are weak and show little evidence of support while MACD and stochastic suggest lower prices are likely. MACD momentum is bearish, increasing, and well above oversold levels so there is room for the market to run. The stochastic is showing weakness by crossing below the lower signal although it is set up for the index to make a rebound in the near-term. The closest target for support is 2,727, a move below that could lead to much biggest losses.
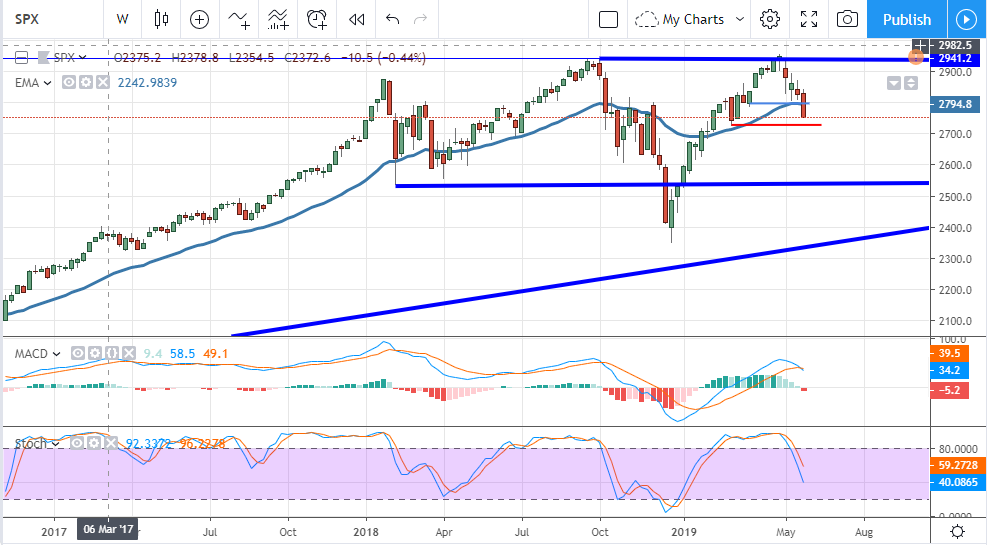
The weekly chart is incredibly bearish. It shows an asset moving lower from the top of a trading range and that move is supported by the indicator signals. The MACD and stochastic are both confirming downward movement and both are still high in their ranges. Downward movement could last for many more weeks and could take the index down to long-term support targets. These targets are near the December lows, around the 2,400 -2,2500 level, and may be reached by the end of the summer.