Making Sense of Forex Market Hours
When you are starting out trading forex pairs, whether it be in the spot market or using binary options, there is a lot of basic information required. Many traders skip over this basic information, and instead seek out strategies immediately. The Forex market is open 24-hours a day because banks/businesses are open at different times around the world, providing liquidity to Forex pairs. Yet each hour of the day has different tendencies based on what part of the globe is open for business. Understand Forex market hours, and hourly tendencies, and you’ll be better able to apply your strategies at opportune times.
Want signals for Forex? We highlight the best service on the Signals page.
Forex Market Sessions
Major markets are open at different times throughout the day. Which market(s) is open directly affects the liquidity and volatility and Forex pairs.
The EUR/USD for example is most liquid and volatile during the London and New York sessions, especially during the “overlap” period when London and New York are both trading.
The USD/JPY typically has the most volatility when Tokyo first opens, and when New York opens many hours later.
Currencies generally see increased liquidity when one or more markets that actively trade, or use, that currency are open for business.
Here are the Forex sessions based on different time zones:
Figure 1. GMT
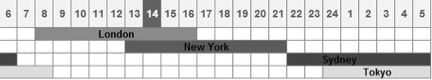
Figure 2. EST (New York)
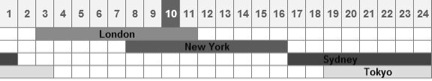
These charts do not show every market in the world, although these are the major ones. The Canadian market is open while New York is open, and London overlaps with other European markets.
Germany opens one hour before London; therefore, some consider that to be the open, and not the start of the London session. Volatility, on average, doesn’t see a marked increased until London opens though.
Top Forex Brokers
| Broker | Min Deposit | Expiry Times | ||
|---|---|---|---|---|
|
|
Pocket Option | $5 | 3 seconds - 1 month | |
 |
Deriv | $5 | 15 seconds - 365 days | |
|
|
Quotex | $10 | 5 seconds - 4 hours |
Intra-Day Volatility
Those major sessions directly impact currency pair volatility. The charts below show hourly volatility. If your strategy is based on volatility or you’re using a trending strategy, focus on times of day where the price moves are largest. The “spikes on the chart” are ideal times, as the price needs to be making higher highs or lower lows in order for volatility to increase during that time (see: Trading Efficiently – The 2 to 3 Hour Trader).
If you are using more of a range trading strategy, or prefer low volatility, trade during the sedate times, where the charts show decreased hourly volatility.
All figures below are current as of January 9, 2014. While subject to change, the charts provide a good overall context for relative intra-day volatility.
Figure 3.
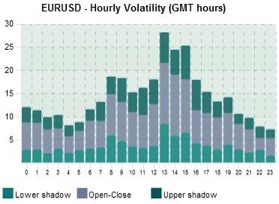
8 to 17 GMT provide the best trending opportunities, with 13 to 17 generally providing the biggest moves.
Those seeking reduced volatility, or times more likely to quietly range, trade between 20 and 5 GMT.
The USD/CHF is very similar to the EUR/USD in terms of its hourly volatility structure, although the USD/CHF moves less overall each day and therefore overall hourly volatility is several pips less.
Figure 4.
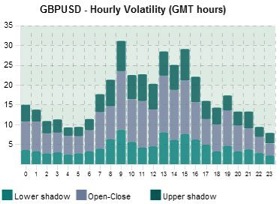
Figure 5.
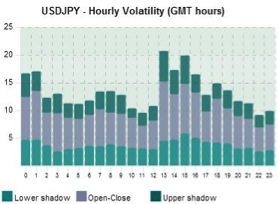
Figure 6.
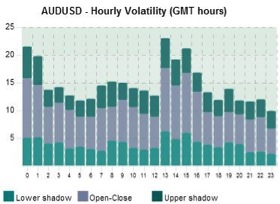
The NZD/USD has very similar hourly volatility to the AUD/USD, and they both move roughly the same amount each day.
Final Word
Learning the basics, such as what the market sessions and hours mean to you as a trader, can significantly help in determining what strategies to exercise and when. No matter what time frame you trade on, you should have a checklist which helps you determine what type of market environment you are trading in. This will also help with filtering trades and capitalizing on good opportunities.