LiteCoin Is Fireing A Classic Buy Signal Right Now
Signals That You Can Bank On
Signals. Signals are the bread and butter of active traders. The problem for traders is that really good signals don’t come around that often and, when they do, you have to be watching the charts when they happen to maximize their value. Today, while flipping through charts looking for something interesting I spotted a signal in the making. More than just a single indicator or pattern, this signal is supported by a host of factors that point to a reversal in Litecoin.
The cryptocurrency market began to move higher a few weeks ago. The market popped last weekend, perhaps sparked by a flight-to-safety trade seen around the world, and now traders are wondering what will happen next. Looking at the Litecoin chart that next move will be upward and it could be strong. Better, the charts looks like this move could have legs and take LTC back up to the $60 range.
Consolidation, Continuation, And Convergence
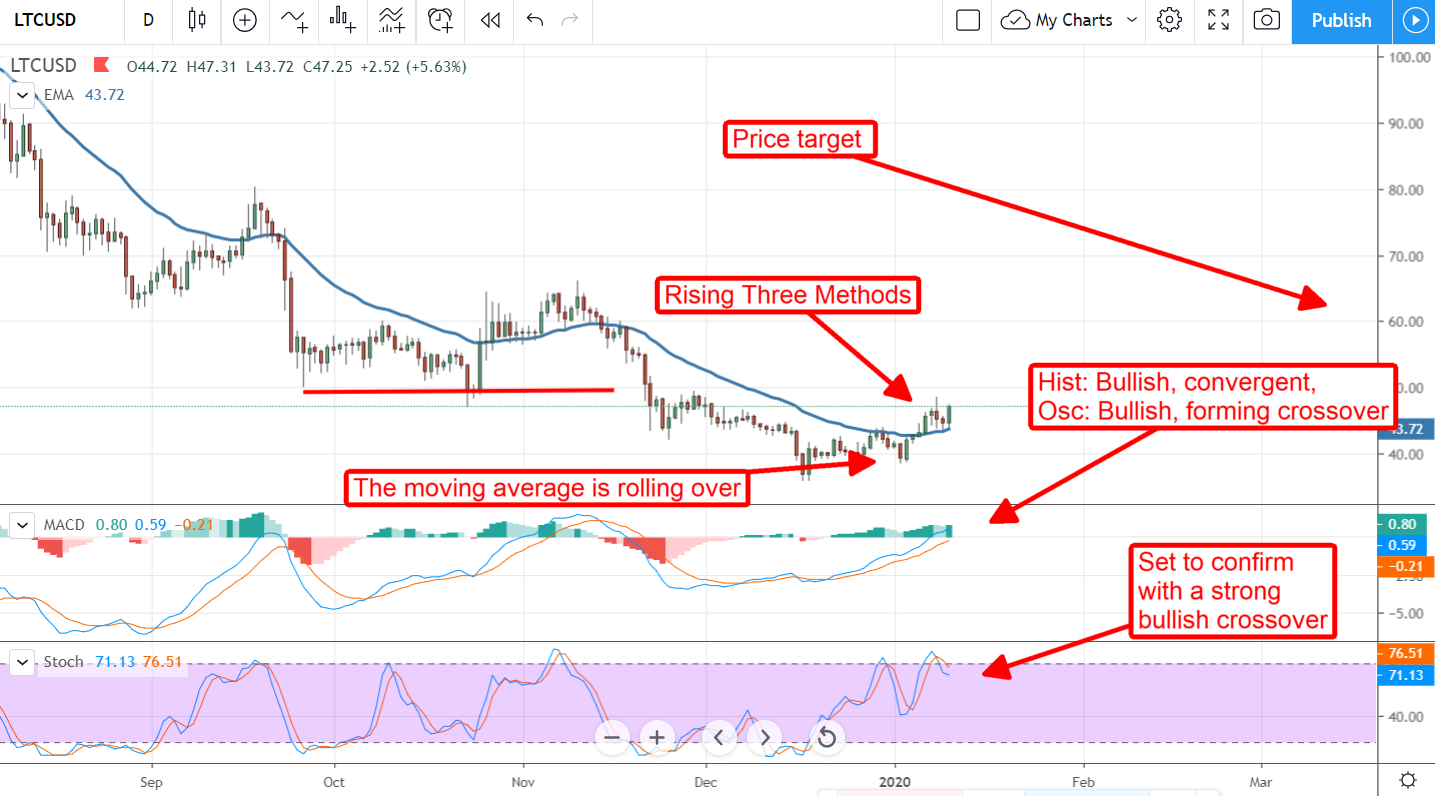
The entire cryptocurrency market is in consolidation following last week’s big moves but the LTC chart looks special. The first clue is the candlestick pattern. Assuming today’s candle closes at or near its current level (as of this writing) LTC is forming a Rising Three Methods. The Rising Three Methods is a well-regarded continuation pattern that is often seen during up trends.
The next clue is the moving average, in this case the 30-day EMA. The price of LTC/USD has been bottoming and with it the down trend in the EMA. The price action is above the EMA, a clue by itself, and the EMA is beginning to curl upward, another clue. The two clues together make a pretty convincing signal from the moving-average perspective but there is more.
The MACD is bullish which is good. What’s better is the MACD is showing strength through convergence. Convergence is when the MACD momentum indicator makes a higher peak coincident with price making a higher peak. In this case, MACD is setting a convergence with today’s candle, the final candle in a bullish chart pattern, so the potential for sharp upward price movement is even more likely.
There are more than one signal in the MACD than convergence in the histogram. The MACD oscillator, from whence the histogram is derived, is trending up and forming a bullish crossover. This shows underlying strength in the market, a shift from bullish to bearish, and leaves plenty of room for the market to run higher.
Stochastic is showing some volatility and that is to be expected, prices made a big move and entered a quick consolidation. The general indication is bullish and trending higher, the set up is one that will lead to a strong bullish crossover providing price action moves higher and soon. If prices can move higher and close higher a price-reversal will be confirmed.