ITM by about 5 Pips
Hello all, I hope everyone had a great day. This trade was from yesterday, and I’m kind of behind by a day, but I will catch up tonight. I made a few trades but I will discuss only one high probability trade.
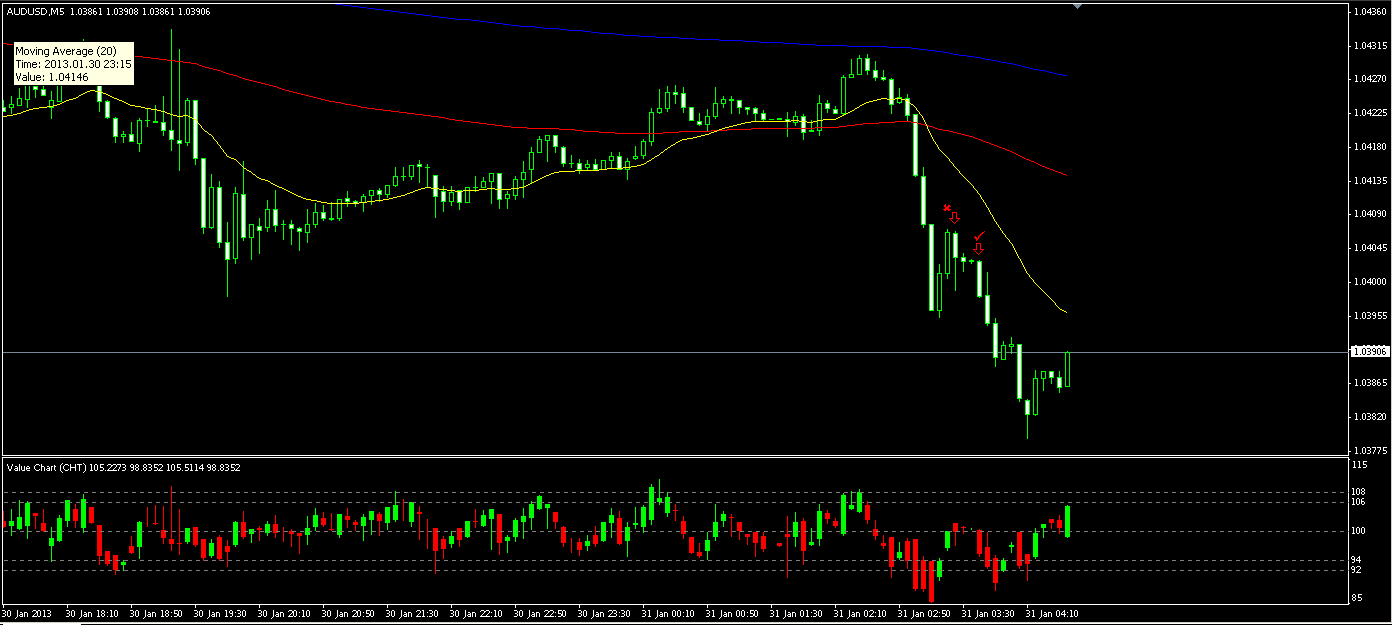
Looking at the overall direction of price, the bears seemed to be in control for the day. Price was slowly rising until it reached the 365day EMA. Once it reached there it turned south again. Now something to note here, if price did in fact go above the 365EMA, I would begin to believe bulls thought price was low enough to begin buying and in result, price would rise. Anyways, as price turned south, I waited for a pullback and a place to enter. Price was moving south at a good speed and each bear bar was very strong with little fight from the bulls. When price moves this sharp in a direction, it is likely it will continue to go in this direction, for the time being. With that in mind, I waited for a pullback that you see on the chat. The chart shows two trades I took, but I lost one because price wasn’t ready to continue down (and I failed to wait for the candle to close on the bar I entered on, which is my fault completely). Well after the buy orders were getting thinner and price was moving in smaller and smaller increments, I was waiting for a breakout of the range. Once price broke below the past few bars low, I believed that price would continue back down.
The reason I placed this trade are as follows: Price overall was in a downtrend, Price was respecting the 180 and 365EMA’s, Price was below the 20EMA, during the pullback, price failed to create higher highs and higher lows, A breakout of the pullback happened sharply, there weren’t any significant bullish reversal bars showing, and the value chart was beginning to turn down. This trade was ITM by about 5 Pips.