Is The Bitcoin Rally Already Over? Not Even Close
A Function Of Healthy Market Mechanics
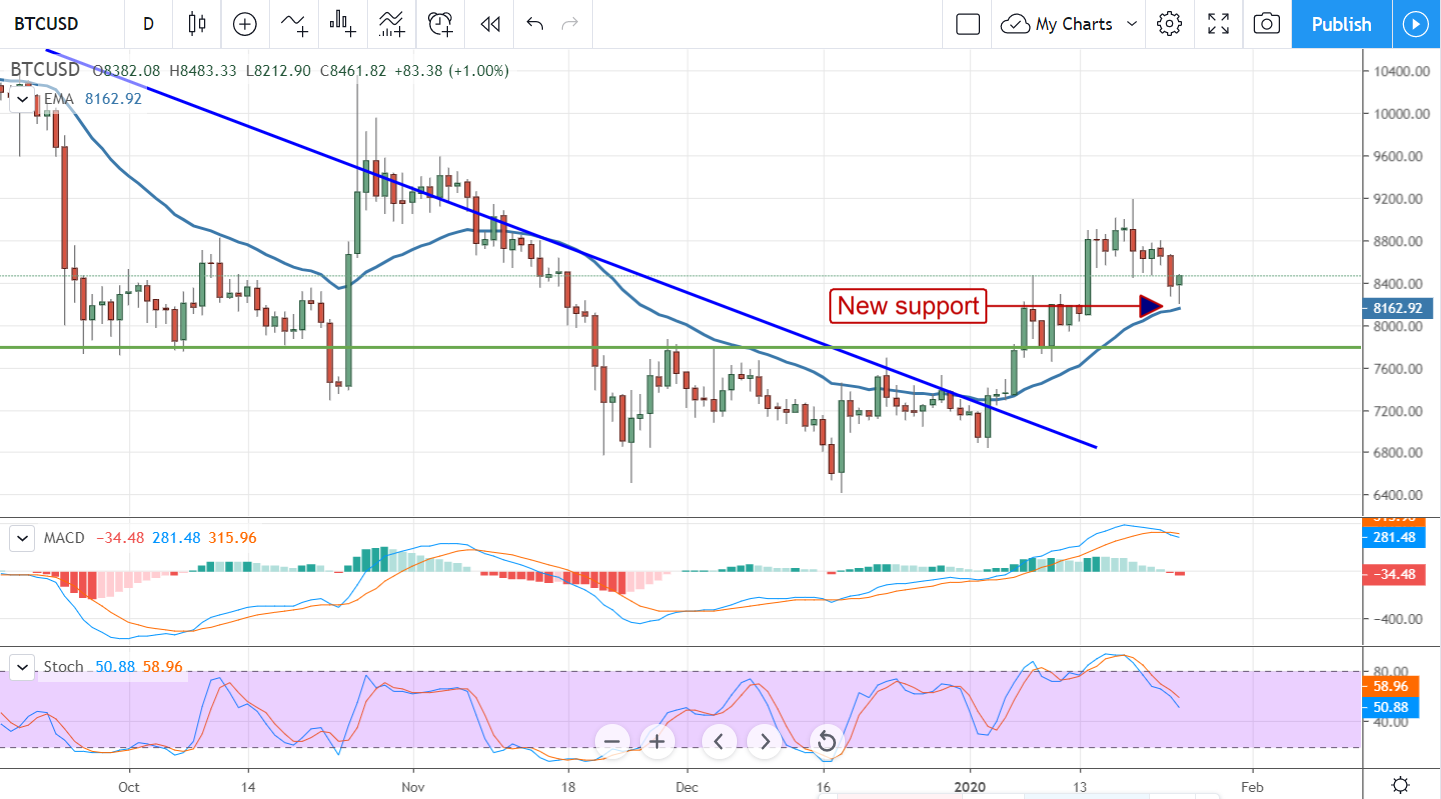
After surging more than 40% over the last two months Bitcoin prices are falling back. The move has now reached the -11% level and threatens to take BTC prices even lower. The good news is that lower prices are not likely, not right now. A look at the charts should be all it takes to get new bulls interested. The market, Bitcoin and the other major cryptocurrencies, is pulling back but to a support level consistent with a text-book buying opportunity.
That’s what I love about the cryptocurrency markets. Aside from supply and the cost of mining there really aren’t any fundamentals to drive the value. The market moves almost entirely on technical signals so, if you are patient enough to wait, clear signals always emerge. The problem for most, and I include myself in that because I can fall prey to the issue, is the cryptocurrency market is very long-term oriented. It can take a long time for those signals to play out.
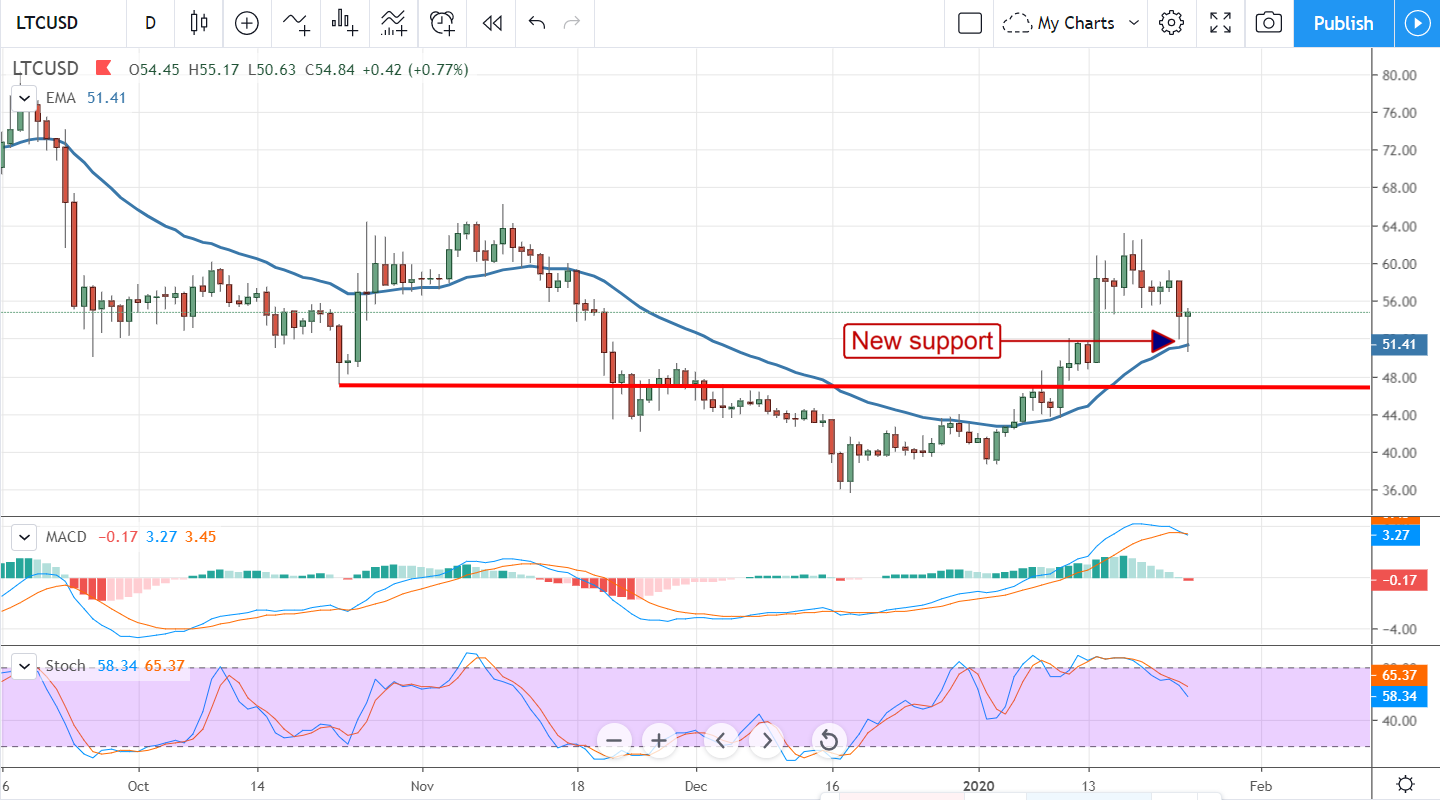
Litecoin Is Leading The Market
Litecoin got a bit of news a few weeks ago when its mining level hit a new two-year low. While concerning, it is not surprising given the passage of LTC’s halveing-driven rally and a similar yet upcoming event for Bitcoin. In the time LTC’s hashrate hit a new low BTC’s hashrate has been moving up to new highs, go figure. Most recently, the LTC hashrate has been forming a bottom so there is some hope the mining community is still solid.
Regarding the rally, LTC/USD moved up more than 75% between December and January and is now in correction. Correction does not mean reversal even though this one has hit 20%. The 20% level usually indicates a bear market, it does not always indicate a major market reversal, and moves of this type aren’t that uncommon on crypto charts. More telling, the correction is finding support at the short-term 30-day EMA where the next rally is likely to form. The indicators are still bearish so I would expected support to be tested, if it is broken price action may move down to $48.
Bitcoin Set Up To Rally Once More, How High Can It Go
The Bitcoin chart is a near-replica of Litecoin’s. After moving up more than 40% the world’s most-important cryptocurrency has entered correction, fallen -11%, and finding support at the short-term EMA. The indicators are bearish suggesting some near-term weakness so caution is still warranted. Assuming a rally is about to form, the indicators are set up to fire a strong trend-following buy signal when prices begin moving up.