Incorporating the MACD Into Your Forex Day Trading
When a strategy provides a lot of signals, such as the one I use for trading a 1-minute or 5-minute chart on the EURUSD (see: Forex Day Trades – October 7 and subsequent posts), some traders may find it beneficial to add an indicator to help them figure out which signals to take and in which direction.
The MACD can help in this regard. The reason I don’t personally use indicators is that there is a tendency to become too reliant on them, and thus get sloppy and lazy in reading the price action. Pay attention to the velocity, direction and magnitude of price moves to get the most insight to what the price is likely to do next. When learning though, a MACD can help you establish when you should be going long, or going short.
Figure 1 shows part of the London session, with the pullbacks marked with arrows as potential entry points in the current trend.
Starting from the left, the MACD stays below the zero line. This indicates the trend is down and you’re only looking for short trades. The down arrows mark all the potential short entries if you were simply to take the shorts at the upper envelope band. I usually wait to see how the price reacts around the band before entering, so my entries don’t always occur right at the band.
Two of the down arrows also have an “x” above them. These are trades I would have missed because I was already short from a prior signal. Not all these trades would have been winners, even though the price continued to trend down.
Figure 1. Entries with MACD Confirmation
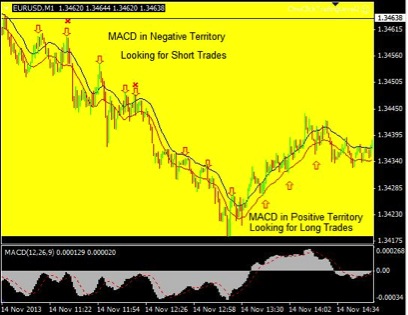
The last downside trade may be a small profit for some traders or a small loss for others depending on how the trade was managed after the price failed to make a new low.
The MACD then moves above the zero line, indicating the short-term trend is to the upside and you’re looking for long/buy trades. Three long trades are marked.
The first two trades are profitable, while the profitability of the third will depend on how the trade is managed. After the third long entry the price makes several small attempt to make a new high, but can’t. This indicates a bigger pullback is likely coming so a small profit should be taken. See How to Read the EUR/USD-October 16 Day Trades for guidance on how to actively manage trades.
Considerations
In figure 1 the both the uptrend and downtrend managed to sustain themselves for at least a few waves, allowing for at least a couple profitable trades.
The MACD will always be either positive or negative, but that doesn’t mean all trades should be taken. If the MACD is moving back and forth across the zero line rather rapidly, then there likely isn’t a sustainable trend worth trading. In the chart above the MACD stays below, and then above, the zero line for some time, which is a sign of a good tradable trend.
If the price isn’t moving in one direction for more than a couple waves at a time, it is probably best not to trade since the price action is too choppy. If you look at a chart and the trend doesn’t look similar to the down or (smaller) uptrend in Figure 1, then trend trading may not ideal in those conditions.
The MACD can help you with deciding which side of the market to trade on–long or short. But you still need to monitor the price action and determine if the trend is strong or weak so you can decide which trades to take.