How To Use The Stochastic Oscillator
Hey Traders,
I hope you are fine.In the previous article I talked about three ways for taking trades after a reversal.In this article I will make some comments for my today trades and I will explain how I use the stochastic oscillator for an extra confirmation in my trades. Here are my trades in 10/4.
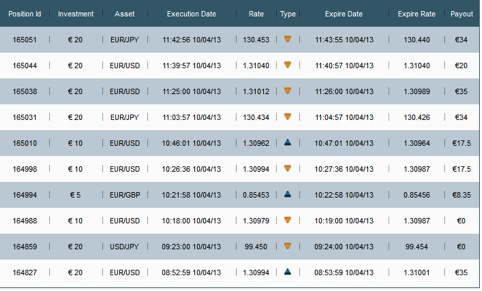
I had 7/9 ITM and one Tie, 78% performance.
The first screenshot is from EUR/USD currency pair and except RSI I use the stochastic oscillator,too.I have the default settings and 20,80 levels.As for the settings you can experiment and adjust them to your timeframes.
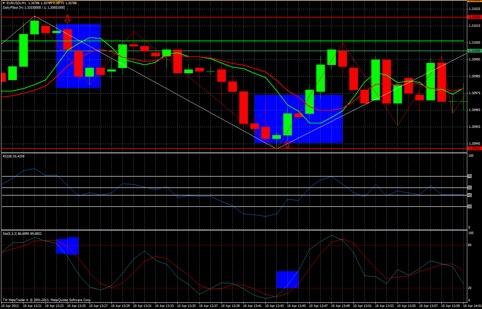
I have two ITM trades in this screenshot.Now, let’s look at the first blue box.It’s my first trade and it’s an ITM put. We have a reversal in the red horizontal line.After that we have a small green candle and then a big red candle which engulfs the green one.As,I said in my previous article this is an engulfing pattern and a sell signal.Of cource, like every trade we need confirmation. Our 8 period RSI is not in oversold condition, this is a good sign but we need more. Look at the stochastic.Notice the blue box.In the beginning you will see that the stochastic is moving above level 80.After some minutes dips below level 80(the blue box).This is my confirmation.When stochastic is moving above level 80 and after that dips below is a sell signal for me.
In the second blue box I have an ITM call. We have a reversal in the red horizontal line down which is our support and I took a call when the second green candle in the row was moving above level 20 of the stochastic.This one it was a little bit risky.
Let’s go the second screenshot.
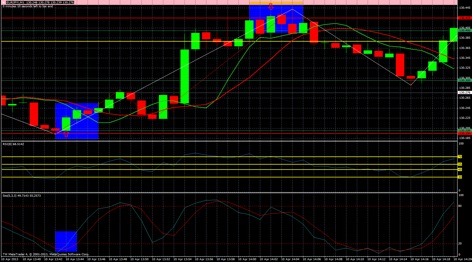
I have two blue boxes in this screenshot.I took my trade in the second blue box.In the beginning of the box we have a new higher/high and after that we have a reversal in the red horizontal line which is our resistance.Then the price hit again the resistance,for the second time and I took a put and it was ITM.
Look at the first blue box. I didn’t take this trade because I wasn’t in front of the monitor but it’s a solid ITM setup. We have a support(the red horizontal line) which is a whole number,too.The price makes a reversal and we have a big green candle, without wick which opened and closed above the last red and its wick.This is a lower/low – higher/high. We are not in an overbought condition and now look at the stochastic. In the beginning is moving below 20 level and some minutes later(when price makes the reversal) got over level 20.
You should always remember that the stochastic is just an indicator and it’s not our entry signal.It’s our confirmation.Price Action is our signal.
Kind Regards,
Kostasze