How To Set Up A Day Trade Using Fibonacci Retracements
As you may know, I really like Fibonacci Retracements. They are a fantastic tool for technical analysis with many uses and applications. Basically, FR’s are target areas for support and resistance based on ancient mathematical relationships found in nature. At heart is the Golden Ratio, which can be found between all living things such as your arm span compared to your height, the pattern of diamonds on the skin of a pineapple and even the distances of market movement within a trend. In particular, FR’s are especially useful for measuring potential areas of support and resistance when an asset has reversed course, or is retracing its prior path. As an asset travels along that path it will make stops at support or resistance that more often than not correspond to the underlying pattern of the universe. Keep in mind though that Fibonacci’s are not signals, just places where signals could be taken. For more informaiton on how to use FR check out my three rules for trading with Fibonacci Retracements.
Where To Begin
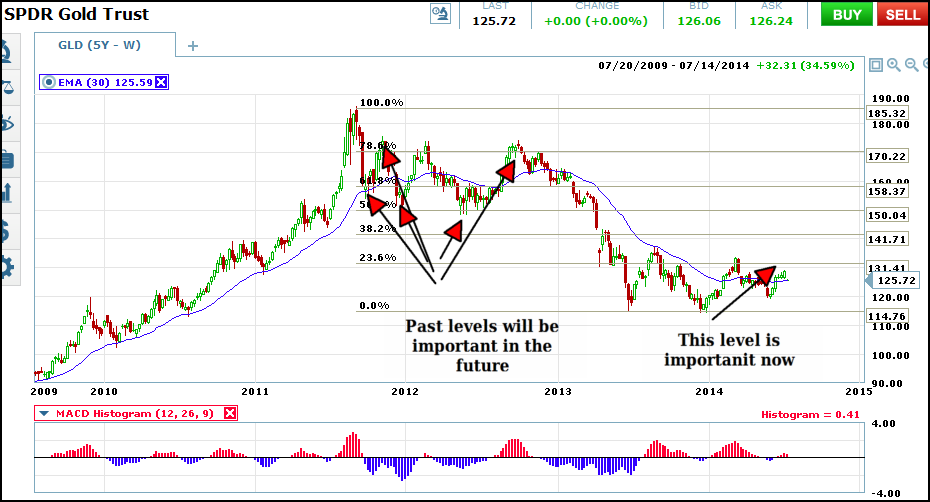
If you need to know more about what a Fibonacci Retracement is this is not the article for you. In this piece I will be looking at how to set up a day trade using the FR tool. To start, I always begin with the chart of weekly prices to see what the underlying trend is. I typically only trade in line with the underlying trend, since we will be making our trade on the chart of hourly or 30 minute prices we will be looking for what is happening in the nearest term, based on the weekly chart. In this example I am going to be using one of the gold indexes, the ETF GLD to be precise, as there has been a lot of activity in that sector over the past few days. I always look at this chart when the market is closed, before the start of the day, so that market noise is lessened. In this example we can see that the GLD hit a bottom in late 2013 so I drew my first FR from the top of the move to the bottom. Looking back you can see how the FR levels are coincident with several points of support and resistance. These levels will be important for future trades once the index reclaims these lofty levels. The 23.6% level is what we are interested in now. Analysis here; the long term trend is down, the index is near resistance with weak candle formation and declining momentum. In the nearest term it looks a bull wave within the long term down trend has peaked, time to look for bearish trades.
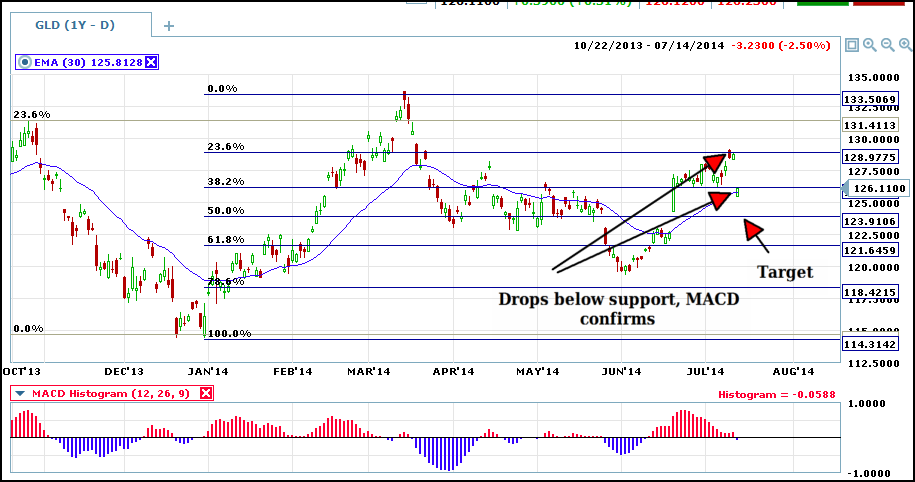
For the next step I move down to a chart of daily candlesticks. In this example the asset is moving sideways within the longer term down trend, between the 0% and 23.6% FR’s. I next draw another FR on the bounce from the 0% to the 23.6% to check on short term areas of support and resistance. It is uncanny how the FR tool matches up with the market. Notice how price behaves around the FR lines. These levels will also all be important during future moves as price action makes it way higher and lower. Most importantly for us is what is happening now, at the hard right edge. Gold prices in the previous session dropped more than 2% causing a similar drop in the ETF. Now prices are below a FR level, indicating that the next lower level is a primary target. MACD only adds confirmation as it has turned bearish coincident with the move below 38.2%. Trading on this chart would require an expiry of at least several days, if not a week or more to ensure the predicted movement has time to occur. For day traders the next move is to move down to a chart of shorter term prices and wait for the market to open.
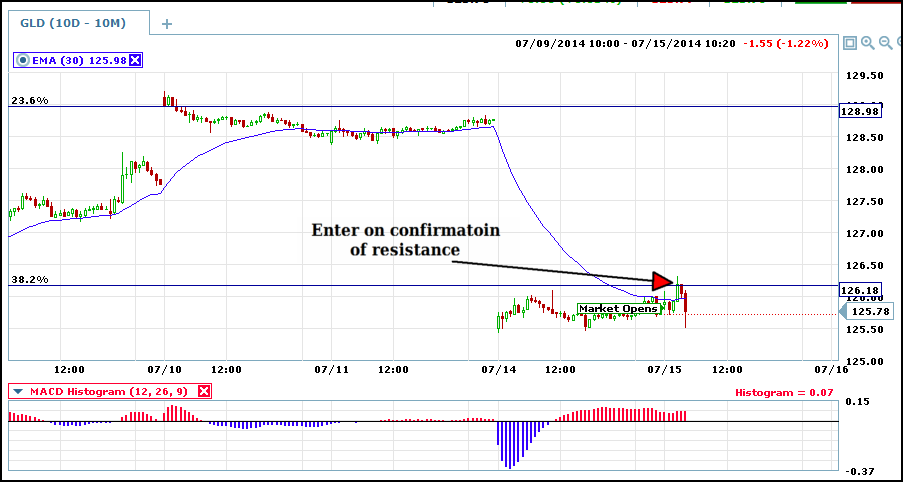
Taking The Trade
Until the market opens we can take a look at how the trade might set up. We can see on the 10 minute chart that the 38.2% line is indeed acting as resistance. MACD indicates that some buying may occur and result in a retest of resistance. So, now is the time to wait for prices to form a new signal, I know that as we wait for the market to open there has been a small bounce in gold prices that will have the GLD at or near resistance once trading begins. A mere cross of the line is not a signal, FR’s are not signals, they are places where signals can form. It is imperative to wait for a signal before trading as whipsaws and false break outs can occur. As price action develops the 30 bar EMA acts as resistance in the first half hour until price breaks and tests FR resistance at the retracement line. The first candle to touch or break the line could be a good entry but additional confirmation is usually a good idea. We can see in our chart that prices are held back be resistance,then form a dark cloud cover confirming that resistance. That is when you want to enter with short term expiry, in this case a minimum of ten minutes due to the ten minute candle stick. Additional signals can be taken throughout the day as they present themselves.