How I Pick Price Tops and Bottoms
Trying to pick tops and bottoms is taboo in the financial industry. News anchors, columnists and even many text books tell you not to do it. I agree and disagree. The reason picking tops and bottoms can be dangerous is that often there isn’t any sort of strategy; the trader just “thinks” a top or bottom is forming and then jumps into a trade. That will likely lose you a lot money. What I propose is a strategy for picking tops and bottoms where the market provides us with evidence that a turn is occurring. Here’s how to do it.
Not the Exact Top or Bottom
The strategy or analysis method I use for picking tops and bottoms won’t get you in at the exact bottom or top. Trying to pick the exact top or bottom is what gets people in trouble because at the exact top or bottom there is no supporting evidence from the price that a turn is about to come.
Therefore, I want to get into trades very close to a top or bottom, but not right at it. This is accomplished through gathering evidence of where the price may potentially top or bottom–such as at supply or demand levels–and then waiting for the price to confirm my suspicions. Sometimes it will sometimes it won’t, which is why we wait for the price confirmation before making the trade.
The Evidence
To pick a top or bottom there are only two things I need to do:
- Locate in advance supply (for a top) and demand (for a bottom) levels, and mark them on the chart. These are areas where the price is likely to reverse…but I don’t assume that it will.
- Wait for the price to form a small consolidation near a supply or demand zone, and then to break out of that consolidation. If this occurs at a supply level, the breakout and trade should be to the downside (short sale or put). If this occurs at demand, the breakout and trade be to the upside (long trade or call)
This strategy can be used in a ranging market, but generally I like to use it in trends. Trends are typically easier to trade since I will only take the trades that are in alignment with the overall trend. Therefore, in an uptrend, I am looking for bottoms to go long at (calls), and in a downtrend I am looking for tops to short at (puts).
The Trade
Let’s look at a couple examples of what I am talking about. First the uptrend. We find an asset in an uptrend, and then isolate supply and demand zones. These are basically strong resistance and support levels (for more on supply and demand zones see: Supply and Demand – Key Technical Trading Level). You can also draw a trendline along the trend, although I find trendlines are less reliable than the supply and demand zones.
The chart below shows an uptrend, which extends much further back than the chart shows. Therefore, I am looking to go long (buy calls) at bottoms in the uptrend. Figure 1 shows the first step where I put some supply and demand zones on the chart, based on prior price action.
Figure 1. USD/CAD Demand Zones
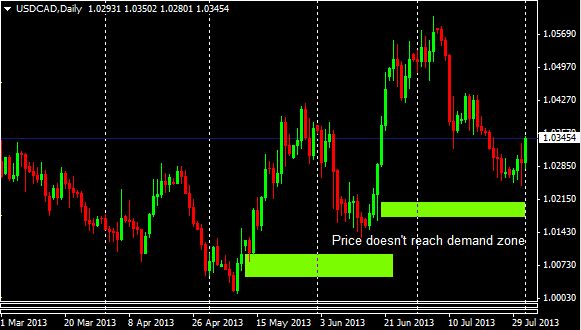
In this case the price doesn’t reach the demand zones. This is typical in a strong trend, and provides evidence that we are trading in the right direction by going long.
The next step is how we get into a trade though. As the price approaches a demand zone we want the price to consolidate. Then we are simply watching for the breakout back in the trending direction. When that breakout occurs, enter long (buy calls). Now these consolidations aren’t going to always be symmetrical and pretty; sometimes a range will develop, other times it will be very choppy.
In Figure 2 I have drawn some lines which contain the consolidation which often occurs “at the turn.” Once the price starts turning back toward the trend direction (via breakout), enter long.
Figure 2. USD/CAD Bottoms Picked.
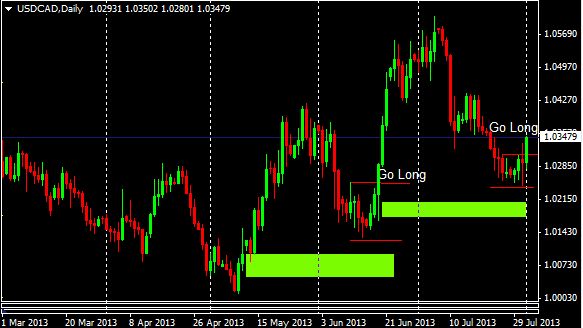
As you can see, by entering as the price breaks above the upper red line in each case, we aren’t getting in at the exact bottom. But it is about as close as we can get while still having evidence to support the trade.
For a downtrend we look to establish supply zones, and then as the price approaches it we want a consolidation to form. Mark the consolidation and if the price breaks below the consolidation enter short (buy puts).
Figure 3. Silver Top Picked
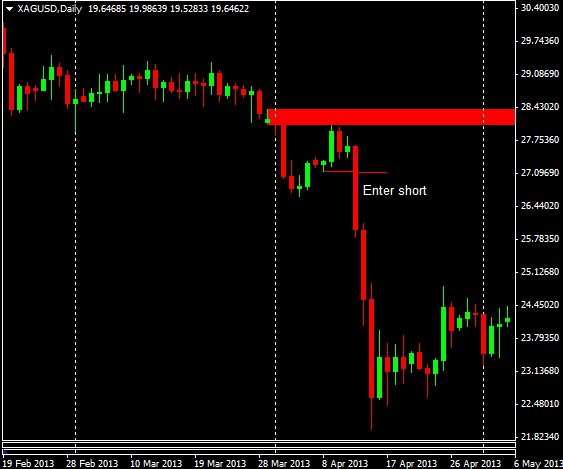
Silver had a strong downtrend at this time, so I was looking for short (buy put) trades. I established the supply zone in advance, as the price pushed toward it I marked the consolidation and when it was broken to the downside I went short.
The Final Word
Establish some supply and demand zones, then wait for the price to move in the anticipated direction before taking a trade. For a trade to occur those criteria must occur–the price is in, near or doesn’t reach the supply/demand zone, and then the price breaks the consolidation in the trend direction. Ideally only trade with the trend, and while you won’t pick the exact top or bottom, you can get pretty close while still taking a trade based on solid evidence.