Hopping into Trades Going with the Trend – Examples (3/3 ITM)
August 14, 2014
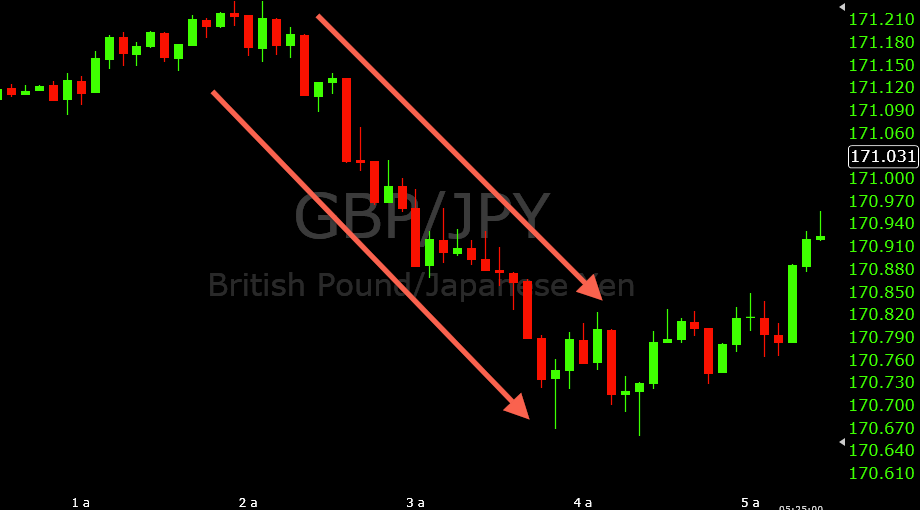
The EUR/USD was uninspiring to start the day so I looked over at my back-up pair, the GBP/JPY, to see if the action was a bit more appealing. No pivot points were in play due to the large trading range from yesterday, but there was a downtrend in effect. This makes things interesting in that, if the downtrend is strong enough, some trade set-ups can occur while going with the flow of the trend.
Trade #1
On the big down-move 3:00AM candle (relative to Eastern Standard Time), it was definitely possible that this downtrend could be one that sustains itself for a while. Either way, it’s definitely not something that you’d want to bet against. So I decidedly hoped to jump into it if the proper opportunity would present itself.
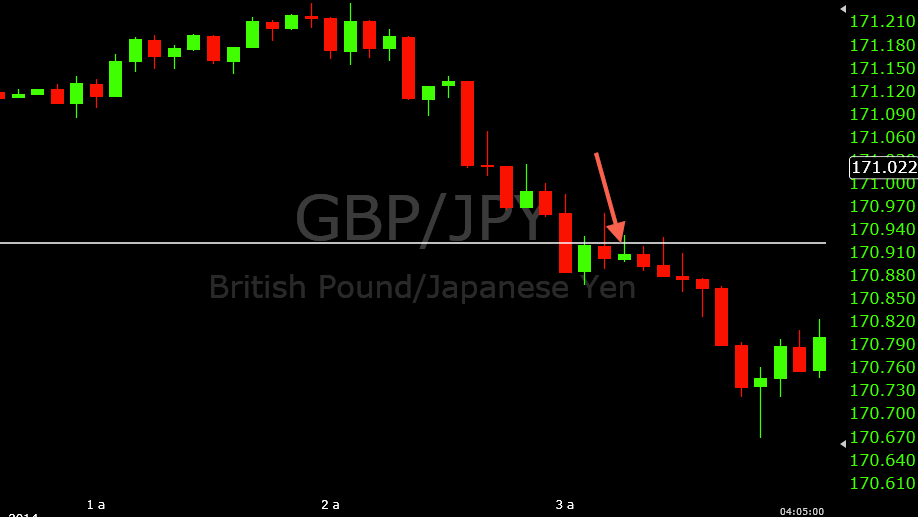
Basically what I wanted was some sort of “touch-of-resistance” trade, given that put options in the context of a strong downtrend have the highest likelihood of panning out. On the 3:05 candle, price came up a few pips, before proceeding up some more and then falling to form a bearish candle on the 3:10.
In a very rudimentary sense, whenever you have a red candle to the right of a green candle (i.e., the market gained ground before falling afterwards), you form a resistance level. It might be a very minor one, as was the case here. But in the market conditions in this scenario, all you really need is a minor resistance level to use as a point of entry.
So after the red 3:10 candle followed the green 3:05, I had a very basic level of resistance to work with. With the steepening gradient of the morning downtrend, I believed I had what I needed to support a put option that would likely pan out. As a result I got into a put option on the touch of the level (roughly 170.924).
This trade worked out very well. I was in-the-money nearly the entire time, aside from a test back toward my entry point on the 3:25 candle (which was promptly rejected). Overall, the continuation of the downtrend netted a nice five-pip winner.
Trade #2
A series of six consecutive red candles carried the downtrend further in steepening nonlinear fashion. The 3:50 candle looked to prolong it further. But I never enter in with the trend randomly. You just never know when things are going to simply stall. It’s why I always prefer to have concrete, predefined points of entry. I believe where you enter in binary options trading is exceptionally important because the margin of win or loss is often so small in short-term trades.
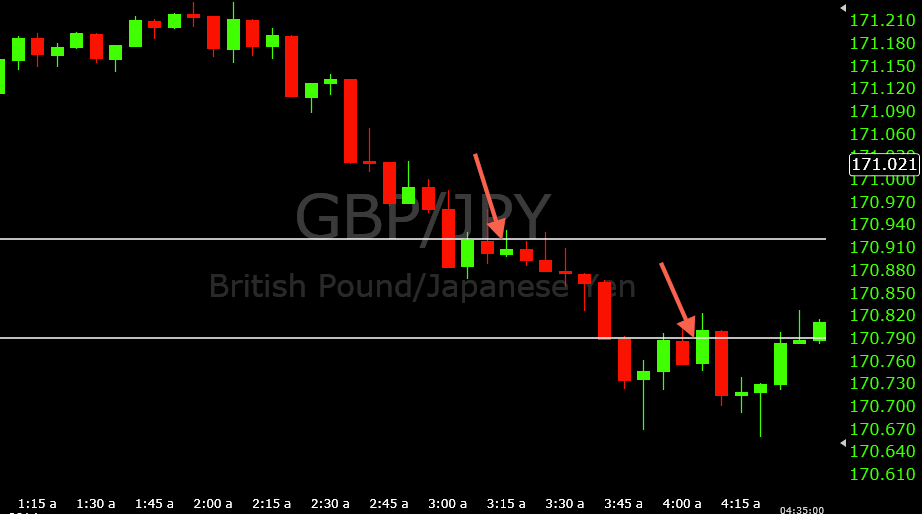
But the 3:50 candle started wicking back up and eventually formed a pinbar. The 3:55 was also green, while the 4:00 was red once again. As I explained earlier, green followed by red makes for a resistance level in some sense. This was the most notable cooling off period for the downtrend in its two-hour history so far but I felt it probably wasn’t finished yet even if this was the first indication that it was losing steam.
The line of resistance from the close of the 3:55 candle/open of the 4:00 represented the 170.788 level. Once the 4:05 candle began, I was looking toward the touch of this level to enter a put option. The 4:05 candle did close above my entry, but there was a nice seven-pip fall on the 4:10 before this trade closed out a winner on the following candle.
Trade #3
My third and final trade of the day came within the same hour. This time I was using the resistance level created from the 4:05 candlestick close/4:10 open, as the basis here. The trend was still clearly down and I figured if I could get a bounce off this resistance level, it would help confirm that the area is reasonably valid for put options.
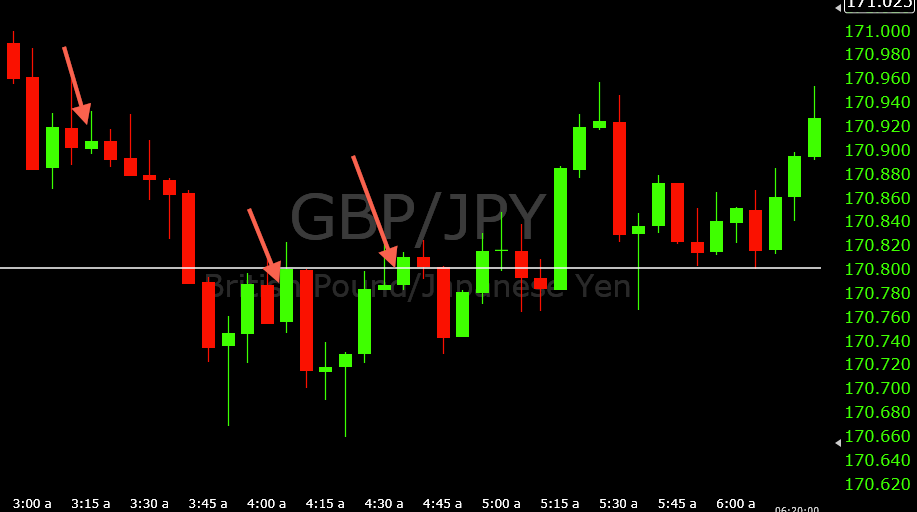
Overall, this put option had the lowest probability of any trade today, given the downtrend was no longer in full force and looked to begin a period of consolidation. But with a bounce and re-touch at 170.801 (where the white line is drawn in the image above), then I’d definitely take it.
The market got around to this level on the 4:30 candle, eventually forming a doji (i.e., going up and wicking back down). So far, so good. On the 4:35 I got a re-touch of 170.801 so I entered the put option. This trade started out like the last one. The entry candle closed above the level. The next candle was red but merely returned back to my entry point. So the next candle would decide the result of this trade. I felt it was most likely to fall given the resistance level and the overall morning downtrend (essentially my reason for entering the trade). It did fall, and produced a six-pip winner.
In closing…
Today marked a unique trading day, different from the ones I’m used to trading and sharing. It’s rare that a market trends strongly. Trending markets are somewhat common out of the gate for the European morning session, but usually not quite to this extent. And the fact that no pivot points were in play made identifying support and resistance – and prospective turning points in the market, in general – more difficult. But there is always more than one way to identify potential support and resistance levels and to trade, in general. And with a strong trend going in your favor, successfully trading this market shouldn’t be too daunting provided you find pretty good points of entry like the ones demonstrated in this article.


