Forget “Crypto Winter”… We Are Entering The Crypto Ice Age.
Another wave of selling has hit the market
Another wave of selling has hit the market and most cryptocurrencies are bleeding value, dropping as much as 40% for the last 7 days and 20% for the last 24 hours alone. The move doesn’t seem spurred by one particular piece of news but rather by a full-scale negative sentiment surrounding digital currencies.
One catalyst for the recent drop could be considered the fact that the US Securities and Exchange Commission (SEC) has postponed once again the ruling regarding the first Bitcoin ETF proposal (initiated by fund manager VanEck and blockchain start-up SolidX), pushing it for early next year (February 27, 2019). This delay is the last available to SEC, so come February next year, they will have to approve or deny the proposal.
Chart Analysis – BTC/USD
Bitcoin is currently trading near $3,400, having lost almost 11% for the last 24 hours and more than 17% during the last 7 days. BTC/USD pair has broken the previous support at 3700, which was considered by many the bottom and seems headed for the new target at 3000.
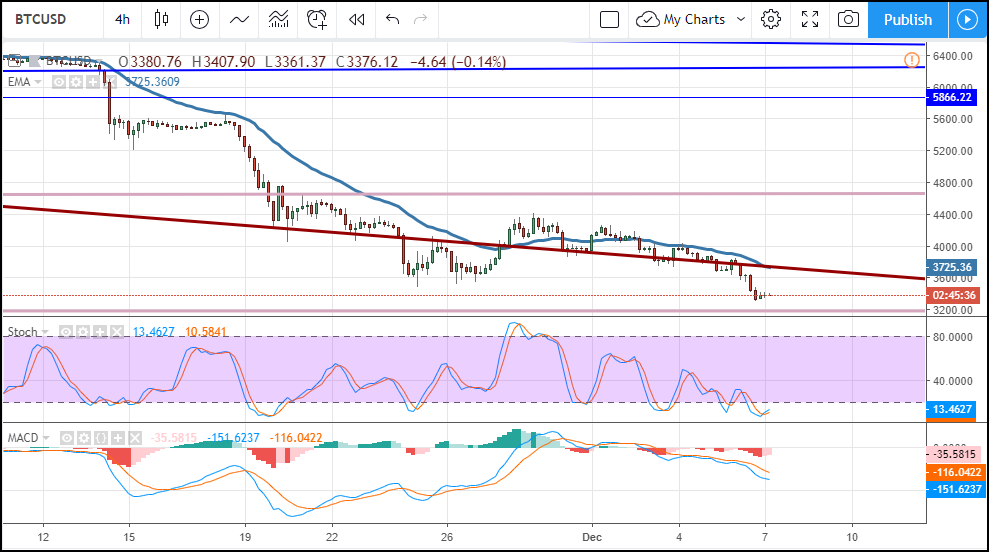
The chart above looks like the perfect downtrend: 50 and 20 Exponential Moving Averages crossed bearishly and moving apart, showing downside momentum; a bullish correction (retracement) was just completed and a significant bottom just broken. All this with a bearish RSI that’s printing lower highs and lower lows on the 4-hour chart, so all clues point towards a drop to 3000 during the next few days.
One of the only signs of bullish reversal is the RSI on a Daily chart, which shows extreme oversold condition and even a bullish regular divergence: price is making a lower low while the oscillator is making a higher low. Is that enough or is it just wishful thinking?
Support zone: 3000 – this is both a technical support last reached in September 2017 and a BRN, thus psychological support
Resistance zone: 3700
Most likely scenario: drop into 3000 support
Alternate scenario: recovery to 3700 based on overextension of the downtrend and RSI Regular Divergence
Ripple’s XRP No Longer The “Most Resilient”
Once deemed the most resistant cryptocurrency during the sell-off, XRP can no longer withstand the bears’ aggression and is losing value as we speak, currently trading at 0.30 against the US Dollar for a drop of 11% for the last 24 hours.
In spite of the bear market, Ripple, NEM, Fetch AI, and Cardano have partnered to establish Blockchain for Europe, which is a lobbying group meant to work with European Union institutions to make sure regulations will not cripple innovation in the blockchain space but also to educate the public on blockchain potential.
Chart Analysis – XRP/USD
XRP/USD briefly dipped below the key 0.30 handle, venturing into 0.29 before printing a bullish candle and recovering feebly above 0.30. The current drop was triggered by the break of the previous low and support at 0.33 and looking at the candles, this doesn’t seem to be the bottom unless we see a fresh wave of investors looking to buy at 0.30.
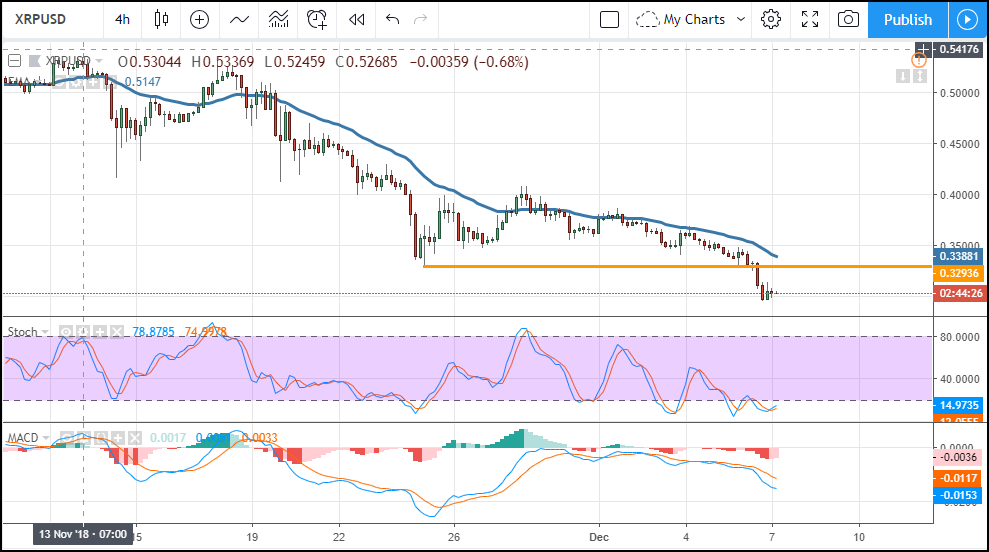
The way price behaves here will trigger one of two scenarios: a break will drive the pair into 0.25, which is both a technical support (last reached in September, current year) and a psychological level (BRN). On the other hand, a bounce higher will meet heavy resistance at 0.33 – 0.35.
Support zone: 0.30 (current support, still intact) followed by 0.25
Resistance zone: 0.33 – 0.35
Most likely scenario: dip below current support
Alternate scenario: bounce higher (0.30 is a big round number and RSI is showing oversold.