Forex Majors – Technical Overview And Weekly Price Forecasts
Dollar Is Strengthening
The week ahead is sprinkled with a few volatility-triggering events, especially for the greenback, which appears to be strengthening across the board. The Fed is back in the spotlight this week with the release of the Meeting Minutes so we can expect strong moves Wednesday on most majors.
EUR/USD – Technical Outlook
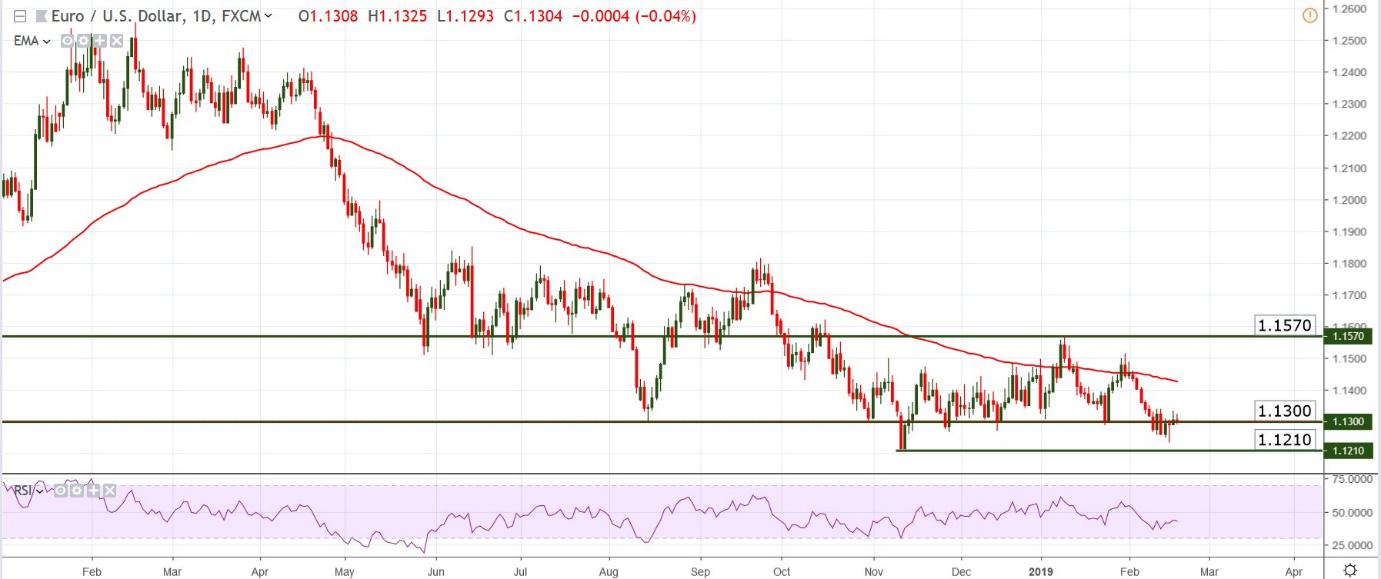
Apart from the Fed Minutes scheduled Wednesday at 7:00 pm GMT, the EUR/USD will be influenced by a few other Euro-related events such as the German Flash Manufacturing and Services PMIs, both slated for release Thursday Feb 21 at 8:30 am GMT and Draghi’s speech scheduled for Friday Feb 22 at 3:30 pm GMT.
The pair is trading in a pronounced range from a Daily chart perspective but the strengthening of the US Dollar took it briefly below the 1.3000 mark where support is still evident. If support holds we can expect to see an extended climb towards the 100 days Exponential Moving Average (red line on chart) but this scenario could take more than a week to develop. Keep in mind that the latest strong move is bearish, the 1.1210 – 1.1200 a likely target if 1.1300 turns into resistance.
USD/JPY – Technical Outlook
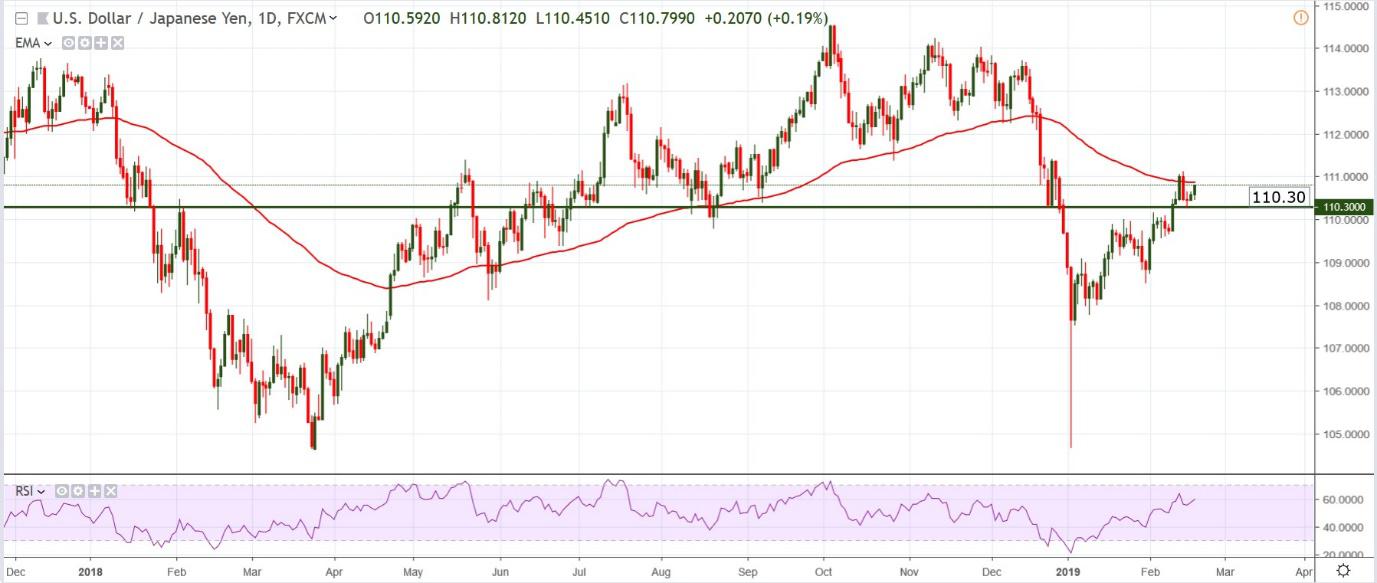
Since the flash-crash on the 3rd of January this year, USD/JPY has been on a bullish ride and is now trading near 110.80. Currently, there’s a battle waging at the 100-day EMA and the winner will very likely control the medium to long term movement. Considering the way the pair has been moving lately, and the overall strength shown by the US Dollar, it’s very likely we’ll see a continuation of the bullish move above the 100 days EMA. The Relative Strength Index is also moving up, printing higher highs and higher lows, without being overbought which supports that view. First resistance and target is the previous top at 111.10 (which may be reached even before the end of this week), followed by 111.50 and 112.00
USD/CHF – Technical Outlook
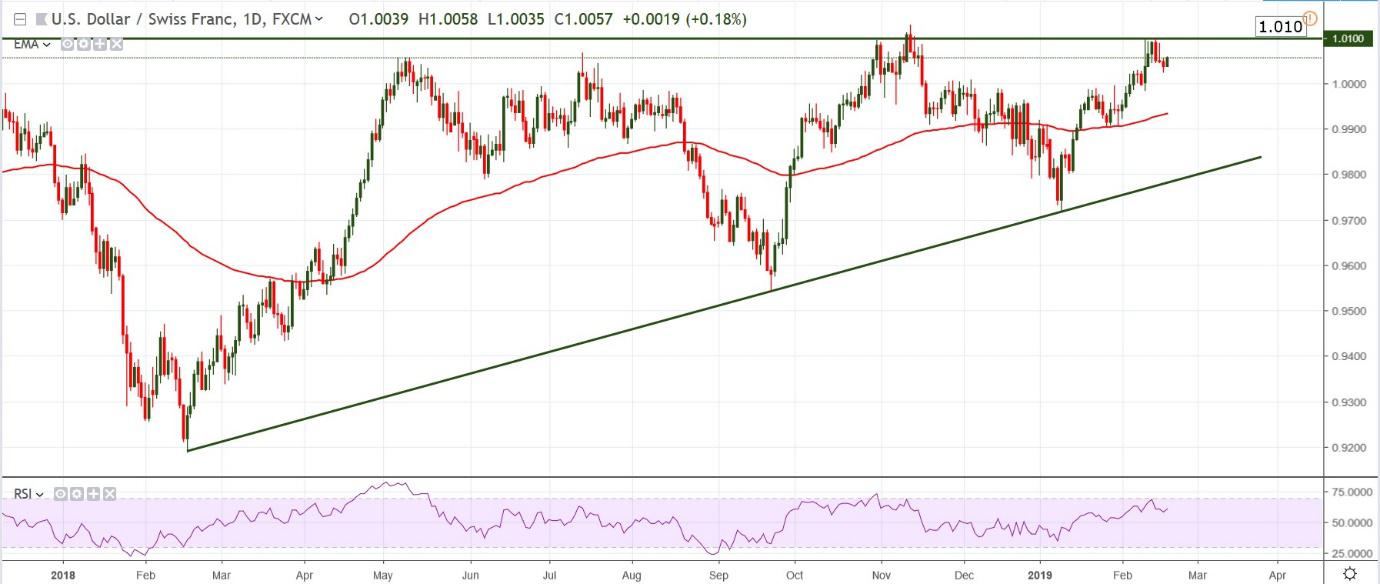
The US Dollar has been strengthening against the Swiss Franc as well lately but the pair has just reached a major hurdle, and a potential turning point, at 1.010. Although it is supported by a long term bullish trend line, the pair has printed an almost perfect double top at a strong resistance leveland the Relative Strength Index is in overbought territory. The double top is an inherently bearish chart pattern and the RSI is another indication that we could see a bearish pullback over the days to come, if not a full reversal. If the pair breaks 1.010, a retracement should follow soon after.
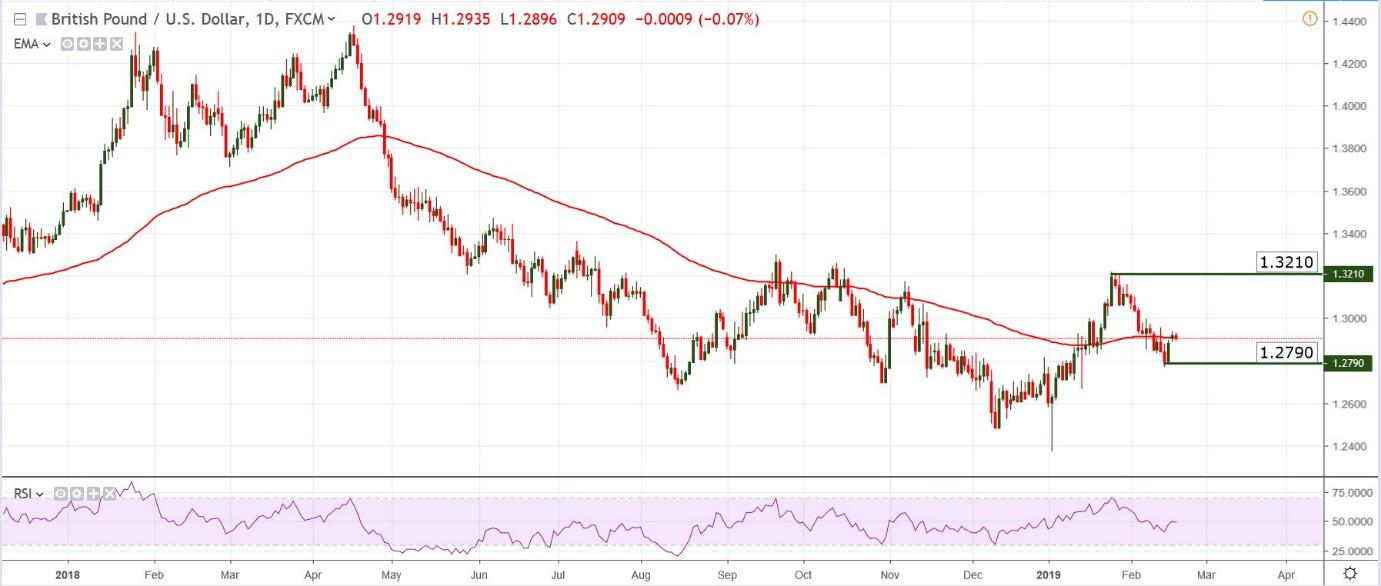
GBP/USD – Technical Outlook
The GBP/USD entered a wide trading range at the end of 2018. Since then it has test for resistance at the top of the range, reaching a high at 1.3210, and is now sitting at support near the middle of said range. The pair is now trading at 1.2900 and has descended below the 100 days EMA were it may consolidate before moving lower. From a longer term perspective, the pair is mostly ranging without a clear direction. This week’s Fed minutes and UK data may change that.